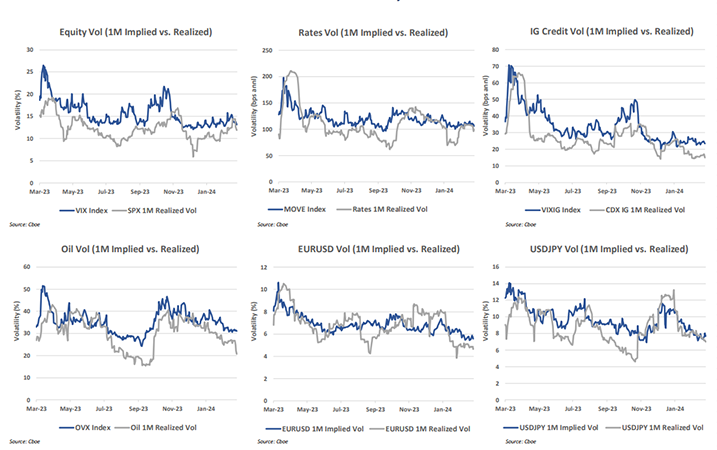
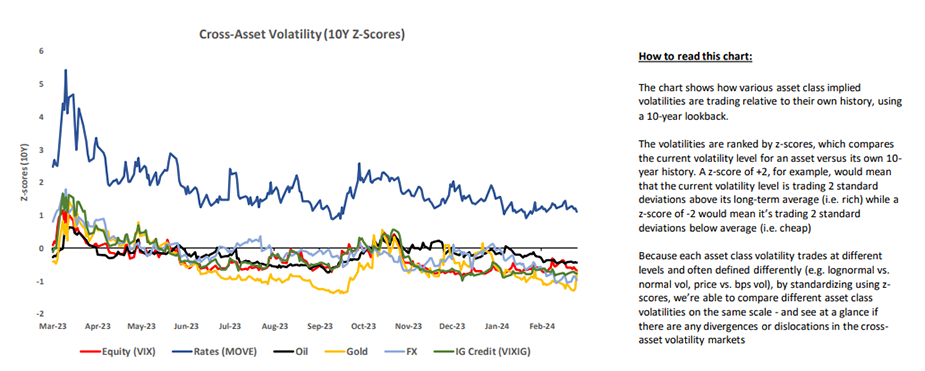
Cross-Asset Volatility: Implied volatilities were mixed across asset classes last week as PCE inflation gained in line with expectations. Equities rallied to new highs, while the VIX® index fell 0.6 pt wk/wk to 13.1% (24th percentile low). US rates vol declined marginally while the implied odds of a June rate cut increased to 66% (vs. 57% a week ago). The decline in real rates (US 10-year real yield fell 7bps on Friday) led to a surge in gold prices, with GLD ending the week at a record high. GLD implied vols saw a meaningful bid on the rally, with 1M implied vol up almost 2 vol pts on Friday to 11.4% (39th percentile) and screening as the richest cross-asset vol currently.
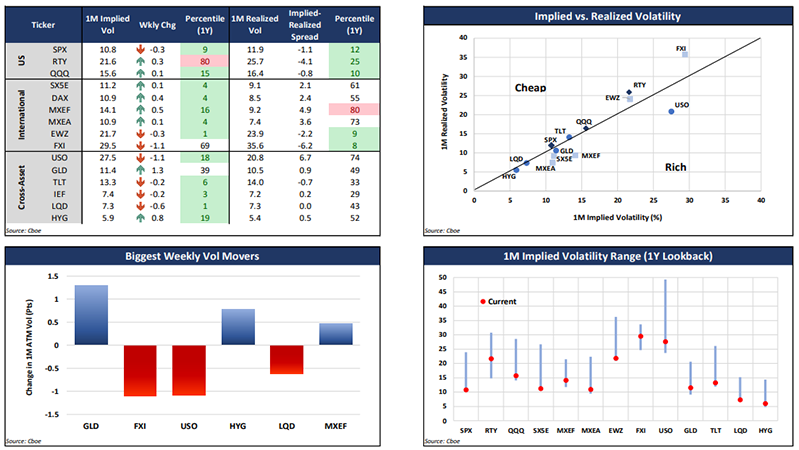
Equity Volatility: While implied volatilities are low across almost all global equity indices currently (RTY being the notable exception), the difference is they’re realizing in the US vs. elsewhere (see Exhibit 1). For example, both SPX and SX5E 1M implied vol are currently trading ~11% but the SPX is realizing ~12% vs. SX5E at 9%. The SPX 1M implied-realized spread, at -1.1%, is currently screening in the 12th percentile low while the SX5E 1M implied-realized spread, at 2.1%, is in the 61st percentile high. The most expensive to carry has been MXEFSM (MSCI Emerging Market Index), with a 1M implied-realized volatility spread of 4.9% (80th percentile high)
Exhibit 1: Implied vs. Realized Volatility (1M)
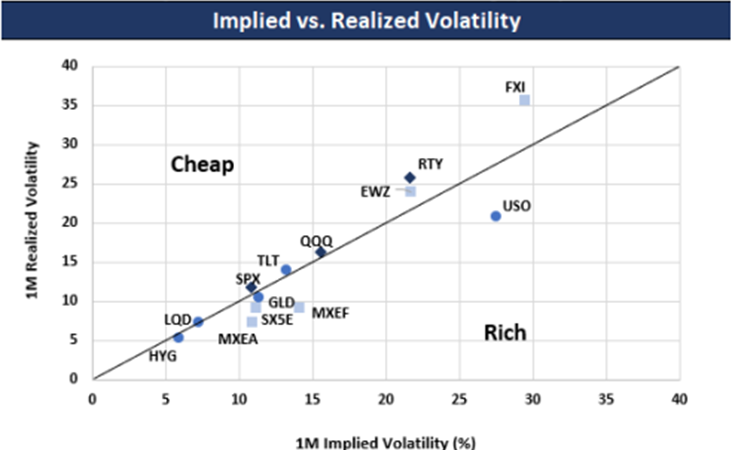
Source: Cboe
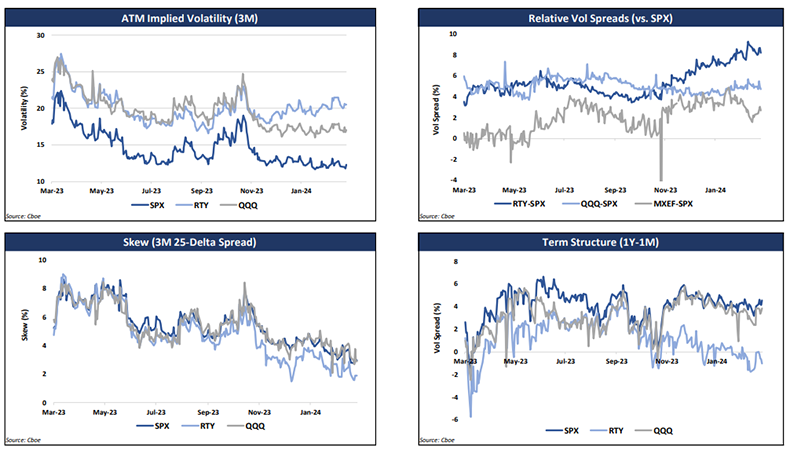
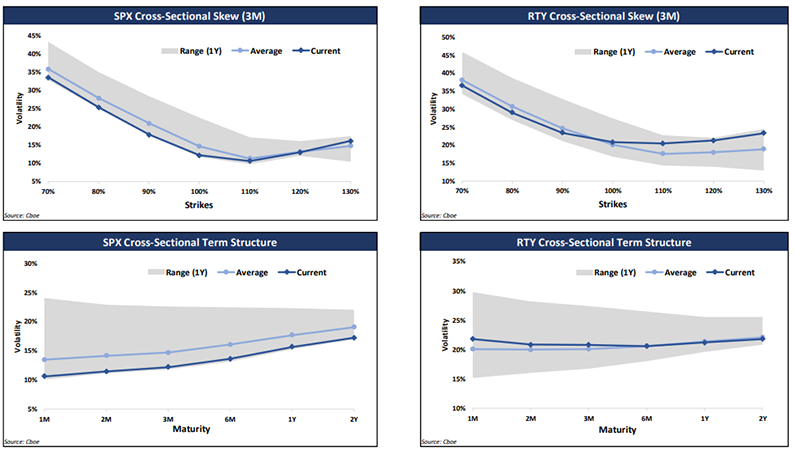
Skew: We highlighted last week the extreme flatness in SPX skew, with 3M 25-delta skew (spread) hitting a 10-year low of 2.8%. As low as implied skew has gotten, realized skew is even more extreme, with SPX realizing higher volatility on up days than down days. As Exhibit 2 shows, realized skew has been inverted in SPX since 2022 – partly explaining why implied skew has been so low the past two years. Markets have been taking the escalator down and the elevator up – so to speak – reversing the traditional behavior. This has gotten even more extreme so far in 2024, with a realized skew spread of -2.9% (i.e. SPX trading ~3 pts more volatile on up days than down days this year) – the most extreme in over 20 years (see Exhibit 3).
Exhibit 2: SPX Realized Vol on Up vs. Down Days
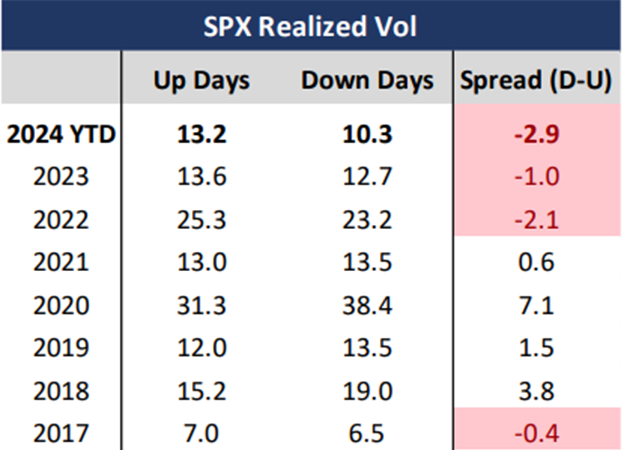
Source: Cboe
Exhibit 3: SPX Realized Skew Most Inverted Since 2002
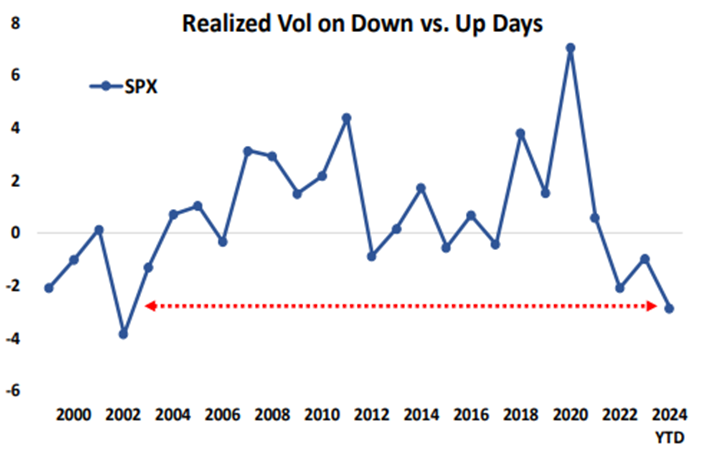
Source: Cboe
Term Structure: SPX term structure steepened last week, with the 1Y-1M vol spread widening from 4.0% to 4.5% (58th percentile high), led by a decline in the front-end of the curve.
Correlation & Dispersion: Implied correlations have continued to decline steadily this year, with SPX 6M implied correlation, as measured by the COR6M Index, falling to a new record low of 18.7% last week. Despite macro-overhangs, investors remain focused on idiosyncratic, sector, and thematic risks – all contributing to the lack of bid for index vol (and hence low correl).
Cross-Asset Volatility Monitor
Source: Cboe
Cross-Asset Volatility Snapshot (10Y Lookback)
Source: Cboe
Cross-Asset Correlation Matrix (1M)
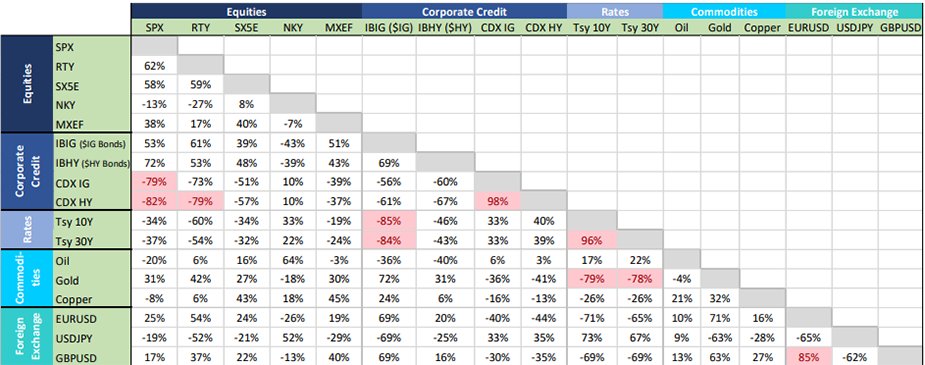
Source: Cboe
Cross-Asset Correlation Analysis
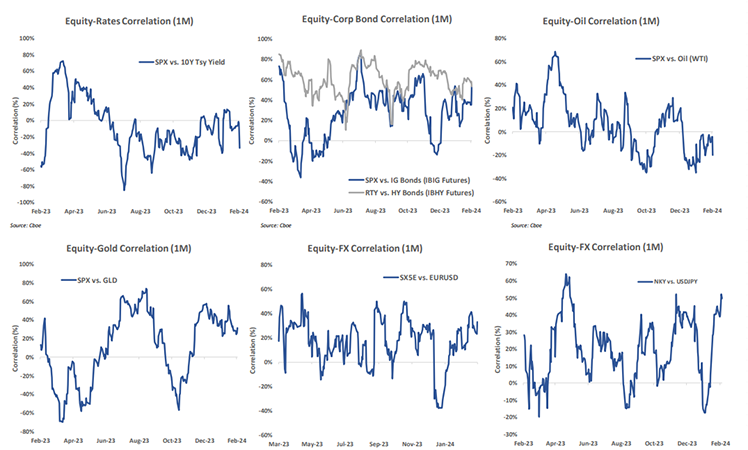
Source: Cboe
Macro Equity Volatility
Source: Cboe
VIX Index Volatility

Source: Cboe
US Index Volatility
Source: Cboe
—
Originally Posted March 7, 2024 – SPX® Realized Skew Most Inverted in Over 20 Years
Disclaimers:
The information provided is for general education and information purposes only. No statement provided should be construed as a recommendation to buy or sell a security, future, financial instrument, investment fund, or other investment product (collectively, a “financial product”), or to provide investment advice.
In particular, the inclusion of a security or other instrument within an index is not a recommendation to buy, sell, or hold that security or any other instrument, nor should it be considered investment advice.
Past performance of an index or financial product is not indicative of future results.
The views expressed herein are those of the author and do not necessarily reflect the views of Cboe Global Markets, Inc. or any of its affiliates.
There are important risks associated with transacting in any of the Cboe Company products or any digital assets discussed here. Before engaging in any transactions in those products or digital assets, it is important for market participants to carefully review the disclosures and disclaimers contained at: https://www.cboe.com/us_disclaimers/
These products and digital assets are complex and are suitable only for sophisticated market participants. In certain jurisdictions, including the United Kingdom, Cboe Digital products are only permitted for investment professionals, certified sophisticated investors, or high net worth corporations and associations.
These products involve the risk of loss, which can be substantial and, depending on the type of product, can exceed the amount of money deposited in establishing the position. • Market participants should put at risk only funds that they can afford to lose without affecting their lifestyle.
© 2024 Cboe Exchange, Inc. All Rights Reserved.
Disclosure: Cboe Global Markets
Options involve risk and are not suitable for all investors. Prior to buying or selling an option, a person must receive a copy of Characteristics and Risks of Standardized Options. Copies are available from your broker, or at www.theocc.com. The information in this program is provided solely for general education and information purposes. No statement within the program should be construed as a recommendation to buy or sell a security or to provide investment advice. The opinions expressed in this program are solely the opinions of the participants, and do not necessarily reflect the opinions of Cboe or any of its subsidiaries or affiliates. You agree that under no circumstances will Cboe or its affiliates, or their respective directors, officers, trading permit holders, employees, and agents, be liable for any loss or damage caused by your reliance on information obtained from the program.
Copyright © 2023 Chicago Board Options Exchange, Incorporated. All rights reserved.
Disclosure: Interactive Brokers
Information posted on IBKR Campus that is provided by third-parties does NOT constitute a recommendation that you should contract for the services of that third party. Third-party participants who contribute to IBKR Campus are independent of Interactive Brokers and Interactive Brokers does not make any representations or warranties concerning the services offered, their past or future performance, or the accuracy of the information provided by the third party. Past performance is no guarantee of future results.
This material is from Cboe Global Markets and is being posted with its permission. The views expressed in this material are solely those of the author and/or Cboe Global Markets and Interactive Brokers is not endorsing or recommending any investment or trading discussed in the material. This material is not and should not be construed as an offer to buy or sell any security. It should not be construed as research or investment advice or a recommendation to buy, sell or hold any security or commodity. This material does not and is not intended to take into account the particular financial conditions, investment objectives or requirements of individual customers. Before acting on this material, you should consider whether it is suitable for your particular circumstances and, as necessary, seek professional advice.
Disclosure: Options Trading
Options involve risk and are not suitable for all investors. Multiple leg strategies, including spreads, will incur multiple commission charges. For more information read the “Characteristics and Risks of Standardized Options” also known as the options disclosure document (ODD) or visit ibkr.com/occ
