A Cyclical Bull Market
Investopedia is partnering with CMT Association on this newsletter. The contents of this newsletter are for informational and educational purposes only, however, and do not constitute investing advice. The guest authors, which may sell research to investors, and may trade or hold positions in securities mentioned herein do not represent the views of CMT Association or Investopedia. Please consult a financial advisor for investment recommendations and services.
A Cyclical Bull Market
Let’s start this Friday off by sifting through the noise, providing some perspective (as opposed to freaking out after watching an episode of your favorite political news (ahem… entertainment) station. 🙂
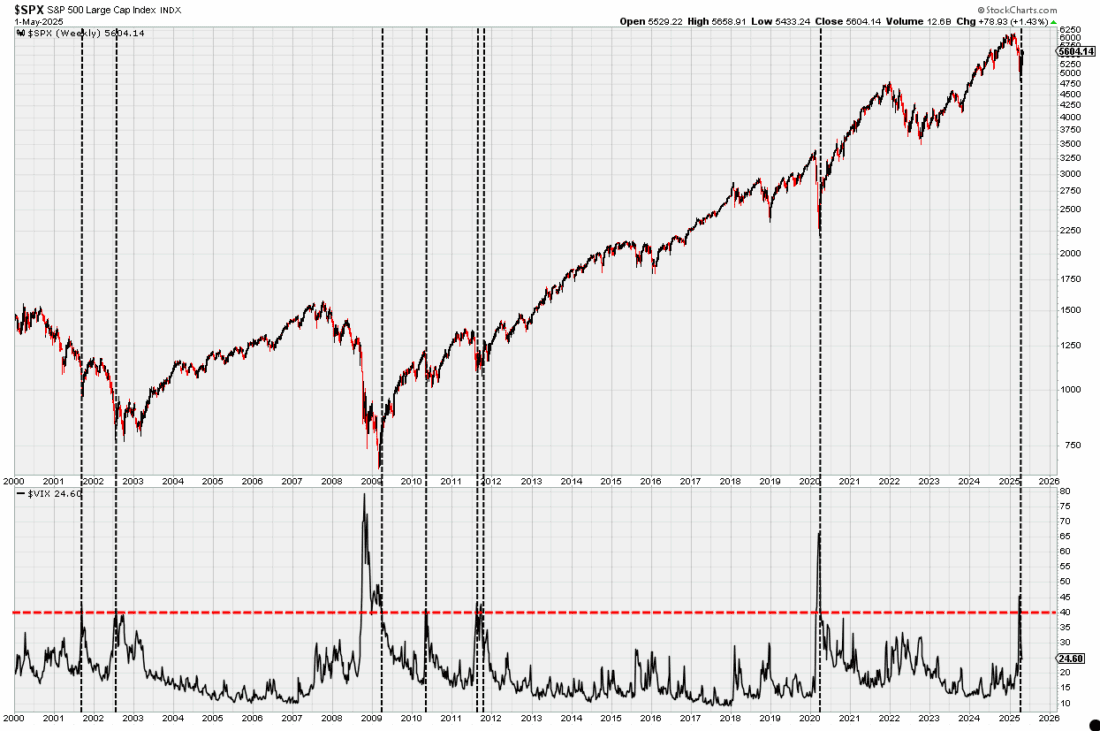
Below is the S&P500 in the upper pane, and the Volatility Index (VIX) in the lower pane. I drew a horizontal red line at 40, because the VIX doesn’t cross above/below 40 very often.
In fact, you have to squint to see these crosses in 2010 and 2011, but here’s the point…
There have only been 7 times in more than 25 years that the VIX crossed above/below 40, and when it did, it marked pretty close to the bottom of the market when the S&P500 was in a cyclical bull.
However, when you look at 2000-02, you can see that during a cyclical bear market, this signal did NOT mark the bottom.
So, ask yourself… “Are we in a cyclical bull market – or are we in a cyclical bull market?”
I’m seeing a lot on the internet about the outperformance of international stocks vs. U.S. stocks these days, and there are two things I don’t like about it.
First off, every investor has their own timeframe, and thacw[is outperformance is currently short-term, not intermediate or long-term. So unless you’re a short-term trader, this shouldn’t mean much to you right now.
The problem is, most investors don’t understand their own timeframe, and many of those posting on social media who are calling on International Stocks to be the new market leaders don’t trade with real money. Rather, they merely share their opinion or analysis.
With that, here’s a chart of the relative strength (RS) relationship between the S&P500 and the All Country World Index Ex-US (ACWX) with a 150-day moving average (150MA).
When the chart is trending up and to the right, the trend is up and in favor of U.S. stocks. When it’s trending down, international stocks are in favor. I add the 150MA to all my RS charts just to have a line-in-the-sand that determines whether RS is trading above or below that line, and whether the line itself is sloping up or down.
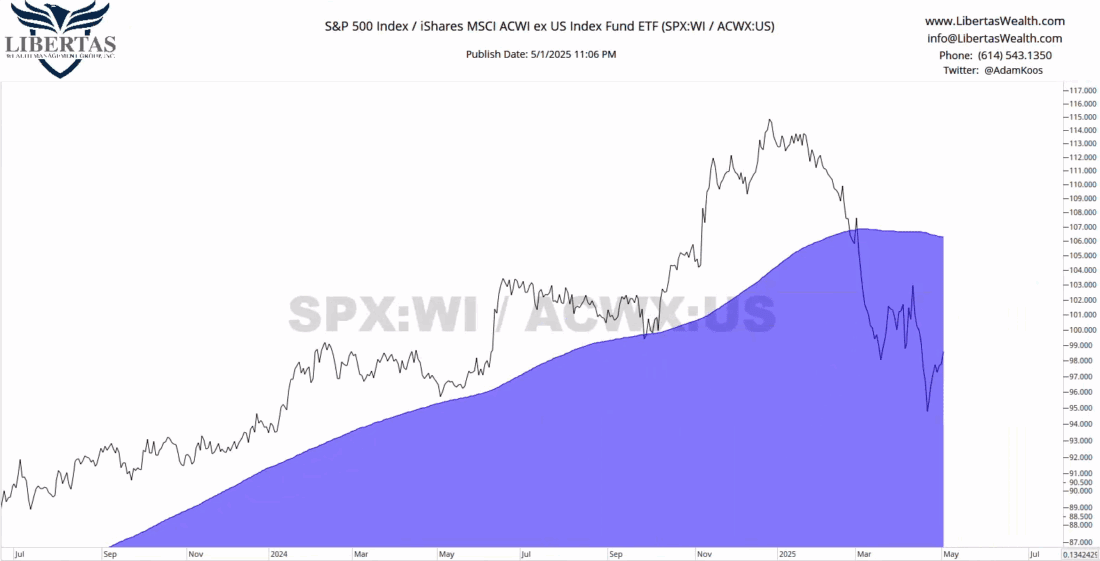
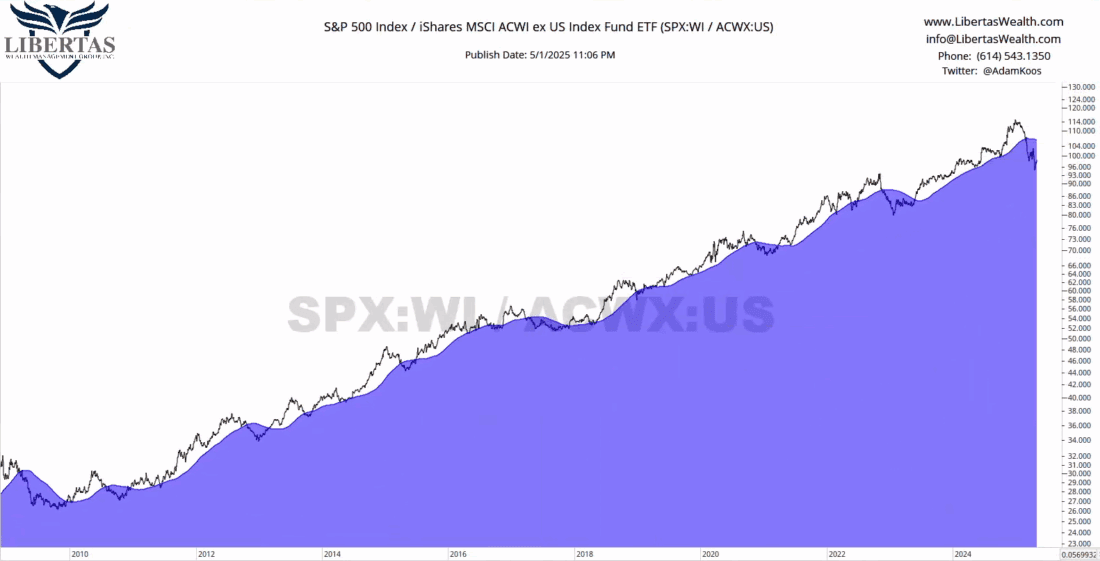
It looks like international stocks are truly outperforming, doesn’t it?! Well… what if we zoom out (see below)?
As you can see, if we go all the way back to the bottom of The Great Recession, the RS relationship between U.S. and International Stocks has done what it’s doing right now… MANY times before!
So, is this the real thing this time, or is this just another head-fake?
For me, I would need to see the RS chart climb back up toward the 150MA, try to get “above water” (i.e., above the blue 150MA line), and fail, heading back down again, printing a new, lower-low – and for now, that simply hasn’t happened yet.
As for the U.S. stock market… just wow! What a difference a month makes. If you went into cryo-sleep on April 1st and woke up on May 1st, almost nothing would’ve happened – stock prices would’ve been in (roughly) the same place they were a month ago!
- While we spent some time in the “DANGER Zone” this past month, the stock market is right back in the “Caution Zone.”
- The bottom of the “Caution Zone” still resides at the spring 2024 lows, which took place after a market correction of just over -10% (sound familiar – this is happening now!),
- …and the “DANGER Zone” still sits just south of 5,000 on the S&P500.
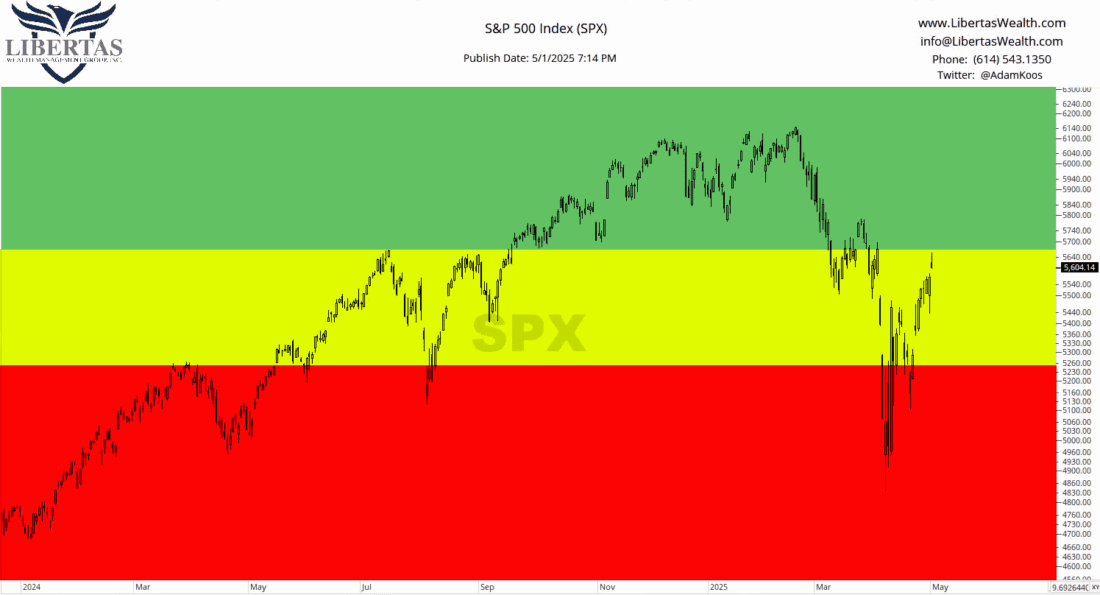
It’s difficult to see, but the S&P500 rose off the early-April lows, pulled back, and then headed higher again, which resulted in a “higher-low” – or in other words, we find ourselves in the midst of a short-term uptrend. The question is, “Will it hold?”
I think it will… and for several reasons:
- Investors have been just as negative (if not worse) than COVID, the mortgage crisis, and the dot-com bubble (this is a contrarian sign),
- Tariff concerns are starting to wane and even China is starting to come to the negotiation table.
- “Liberation Day” (aka: “Strangulation Day”) looks to have been an emotional, news-driven selloff as expected,
- The VIX (volatility index or “fear gauge”) has fallen decisively below levels that have previously been favorable buy signals for the stock market,
- There have been a few, very positive breadth thrusts (which indicate widespread participation in the markets), and
- There are signs that sellers are starting to dry up.
Our tactical, trend-following portfolio models, which were heavily invested in cash and bonds in early-April, have started to scale back into stocks again with 25-67% of each model being invested, depending on the model in question (the remainder being invested in short-term bonds and cash).
If this market continues to “heal” and improve, then we could quickly see these nimbler portfolios fully invested before too long… and if this recent rebound is just a head-fake, then we’d be dialing down the risk again just a soon as the market climate indicates the tornado sirens are going off.
Meanwhile, we’re taking things day-by-day!
—
Originally posted 2nd May 2025
Disclosure: Investopedia
Investopedia.com: The comments, opinions and analyses expressed herein are for informational purposes only and should not be considered individual investment advice or recommendations to invest in any security or to adopt any investment strategy. While we believe the information provided herein is reliable, we do not warrant its accuracy or completeness. The views and strategies described on our content may not be suitable for all investors. Because market and economic conditions are subject to rapid change, all comments, opinions and analyses contained within our content are rendered as of the date of the posting and may change without notice. The material is not intended as a complete analysis of every material fact regarding any country, region, market, industry, investment or strategy. This information is intended for US residents only.
Disclosure: Interactive Brokers Third Party
Information posted on IBKR Campus that is provided by third-parties does NOT constitute a recommendation that you should contract for the services of that third party. Third-party participants who contribute to IBKR Campus are independent of Interactive Brokers and Interactive Brokers does not make any representations or warranties concerning the services offered, their past or future performance, or the accuracy of the information provided by the third party. Past performance is no guarantee of future results.
This material is from Investopedia and is being posted with its permission. The views expressed in this material are solely those of the author and/or Investopedia and Interactive Brokers is not endorsing or recommending any investment or trading discussed in the material. This material is not and should not be construed as an offer to buy or sell any security. It should not be construed as research or investment advice or a recommendation to buy, sell or hold any security or commodity. This material does not and is not intended to take into account the particular financial conditions, investment objectives or requirements of individual customers. Before acting on this material, you should consider whether it is suitable for your particular circumstances and, as necessary, seek professional advice.
Disclosure: ETFs
Any discussion or mention of an ETF is not to be construed as recommendation, promotion or solicitation. All investors should review and consider associated investment risks, charges and expenses of the investment company or fund prior to investing. Before acting on this material, you should consider whether it is suitable for your particular circumstances and, as necessary, seek professional advice.
