Indices are struggling to extend their historic winning streak to 10 sessions today as mounting anxiety regarding the upcoming Fed meeting coincides with a lack of trade deal progress. Investors are concerned that a widely expected pause by the Fed this Wednesday may disappoint the Commander in Chief, who has been vocally calling for lower borrowing costs. Meanwhile, tariffs are a significant focus and while President Trump has signaled the potential for several agreements in the coming days, persistent tensions between Washington and Beijing have traders opting for a half-glass-empty perspective at the moment. Furthermore, a light economic calendar featuring a hotter-than-projected ISM services print consisting of elevated price pressures failed to spark animal spirits, sending yields north instead. Market participants are responding to the uncertainty by scooping up safe-haven gold bars, volatility protection instruments, equity index put options and forecast contracts while they sell stocks, Treasuries, greenback futures and cyclical commodities.
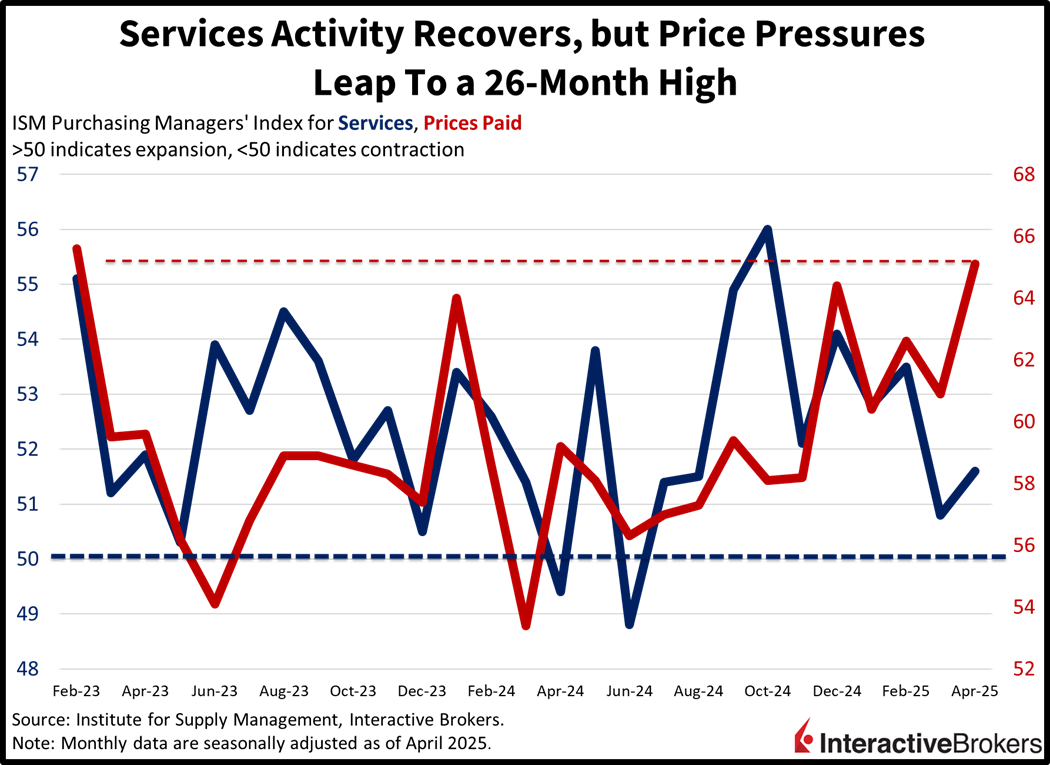
Services Sector Expanded in April
Recovering demand and growing business activity supported progress in the services sectors last month. The Institute for Supply Management’s (ISM) Purchasing Managers’ Index came in at 51.6, above the median estimate of 50.6 and March’s 50.8. The production and new orders components drove the beat with scores of 53.7 and 52.3 but levels below the contraction/expansion threshold of 50 in employment, exports and backlogs hurt the headline. Those segments arrived at 49, 48.6 and 48. The prices paid segment also disappointed, ramping up to 65.1, the loftiest since February 2023, marking a 26-month high.
Stocks Climb from Morning Lows
Stocks are well off their lows as the bulls look like they’re trying to engineer an intraday recovery to preserve the winning streak. The major domestic equity benchmarks are now mixed with the Dow Jones Industrial up 0.1%, the Russell 2000 flat and the Nasdaq 100 and S&P 500 down 0.3% each. Sectoral breadth is negative, with 7 out of 11 segments losing on the session. The energy, consumer discretionary and utilities components are trimming the most; they’re retreating 1.7%, 0.8% and 0.4%. Industrials, communication services and real estate are bucking the trend, however, with those spaces climbing 0.5%, 0.3% and 0.2%. Treasuries and the greenback are being sold with the 2- and 10-year Treasury maturities changing hands at 3.84% and 4.34%, 2 and 3 basis points (bps) heavier on the day. The Dollar Index is shedding 38 bps, meanwhile, as the US currency depreciates relative to the euro, pound sterling, franc, yen and Aussie tender but appreciates against the yuan and loonie. Cyclical commodities are trading lower but safe-haven metals are gaining, with crude oil, lumber and copper down 3.2%, 0.8% and 0.2% while gold and silver advance 2.1% and 0.7%. WTI crude is trading at near its lowest in over 4 years of $56.45 per barrel as OPEC+ production increases bolster the supply outlook while trade tensions weigh on demand prospects.
Economy Appears to Be Solid
The first few economic reports we receive for the month of April are pivotal because they provide crucial information on how second quarter momentum is shaping. So far, last week’s prints together with this morning’s recovery in ISM-services point to an economy that remains on solid footing. But outside of today’s data, this Wednesday’s Fed meeting, weekly unemployment claims and quarterly productivity, the domestic calendar is pretty quiet, placing the focus squarely on monetary policy and international negotiations. Finally, an incrementally dovish Fed that conveys concerns over softening labor conditions coinciding with a trade deal or two by Friday will likely offer further gains for equity investors. However, a central bank that communicates heightened worries of the potential for tariff-induced inflation alongside 0 cross-border agreements may result in stocks taking a break.
International Roundup
Singapore Retail Sales Fall Relative to February
March retail sales in Singapore fell 2.8% month over month (m/m) after climbing 3% in February. For the year-over-year (y/y) metric, sales climbed 1.1% following a 3.5% decline in the second month of the year. When compared to February, increases were limited to the following three categories:
- Watches and jewelry, up 8.6%
- Recreational goods, up 5.6%
- Department stores, up 4.8%.
The motor vehicle category recorded the largest decline with sales contracting 12.4%. The other category declined 11.3% and the third-largest drop was optical goods and books, which sank 7.7%.
The separate index for the food and beverage sector sank 3.2% and 2.8% m/m and y/y, respectively.
Eurozone Sentiment Strengthens but Remains Negative
The Sentix Investor Confidence Index improved from -19.5 for April to -8.1 and was stronger than the consensus estimate of -14.9. Additionally, the current situation gauge climbed from -23.3 to -19.3 and the expectations metric moved into positive territory with a May score of 3.8, up from -15.8. Sentix commented that the results imply investors no longer anticipate the economy is heading for recession. Sentix also believes the improved sentiment is a result of the European Commission responding appropriately to Trump tariffs.
Disclosure: Interactive Brokers Affiliate
Information posted on IBKR Campus that is provided by third-parties does NOT constitute a recommendation that you should contract for the services of that third party. Third-party participants who contribute to IBKR Campus are independent of Interactive Brokers and Interactive Brokers does not make any representations or warranties concerning the services offered, their past or future performance, or the accuracy of the information provided by the third party. Past performance is no guarantee of future results.
This material is from IBKR Macroeconomics, an affiliate of Interactive Brokers LLC, and is being posted with its permission. The views expressed in this material are solely those of the author and/or IBKR Macroeconomics and Interactive Brokers is not endorsing or recommending any investment or trading discussed in the material. This material is not and should not be construed as an offer to buy or sell any security. It should not be construed as research or investment advice or a recommendation to buy, sell or hold any security or commodity. This material does not and is not intended to take into account the particular financial conditions, investment objectives or requirements of individual customers. Before acting on this material, you should consider whether it is suitable for your particular circumstances and, as necessary, seek professional advice.
