The Trump Administration’s goals of onshoring manufacturing activities and reducing government spending were front and center in this morning’s preliminary read on US economic growth to begin the year. Despite the quarterly contraction, which was driven by a surge in imports ahead of the April 2 Trump tariffs, domestic investment surged to its fastest pace of expansion since the pandemic related recovery in 2021, over three years ago. Meanwhile, efforts to trim the fiscal deficit were well represented in the publication as well, with governmental consumption expenditures declining for the first time in 11 quarters. But the negative headline on GDP and a big miss in the ADP employment print is generating hesitation in markets and stocks are poised to end their winning streak. Investors are tilting towards a risk-off posture against this backdrop as they scoop up Treasuries, greenback futures, volatility protection instruments and forecast contracts while lessening exposure to equities across defensive and cyclical sectors as well as selling off the major commodities.
Economy Contracts During First Quarter
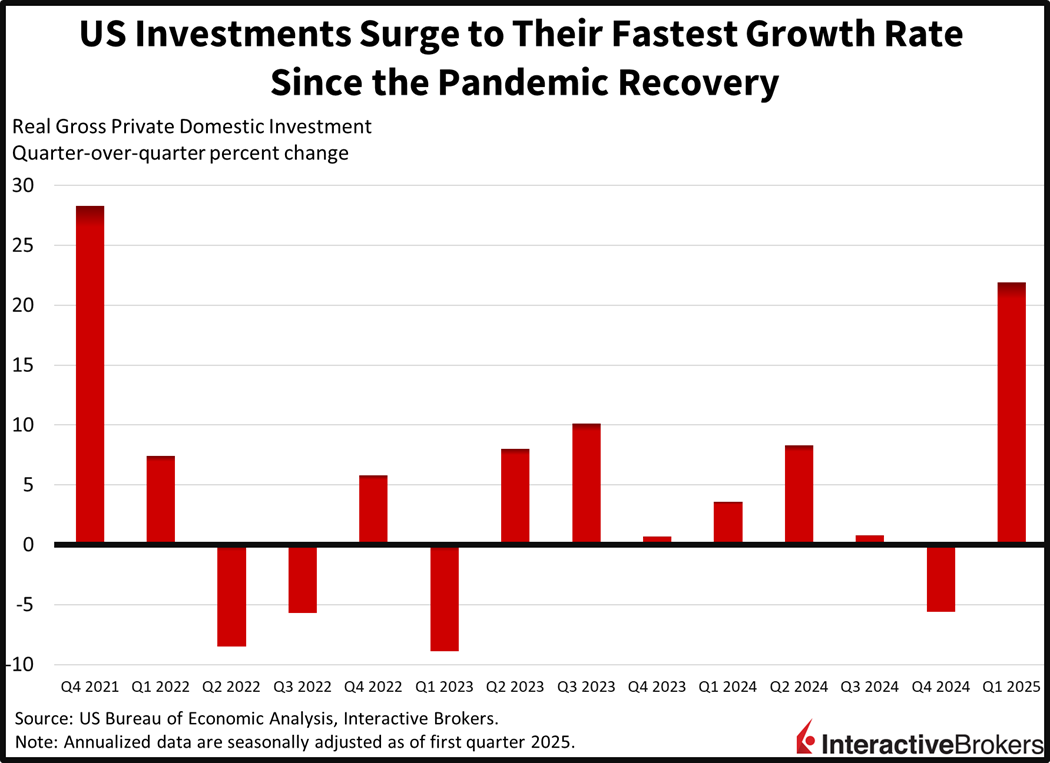
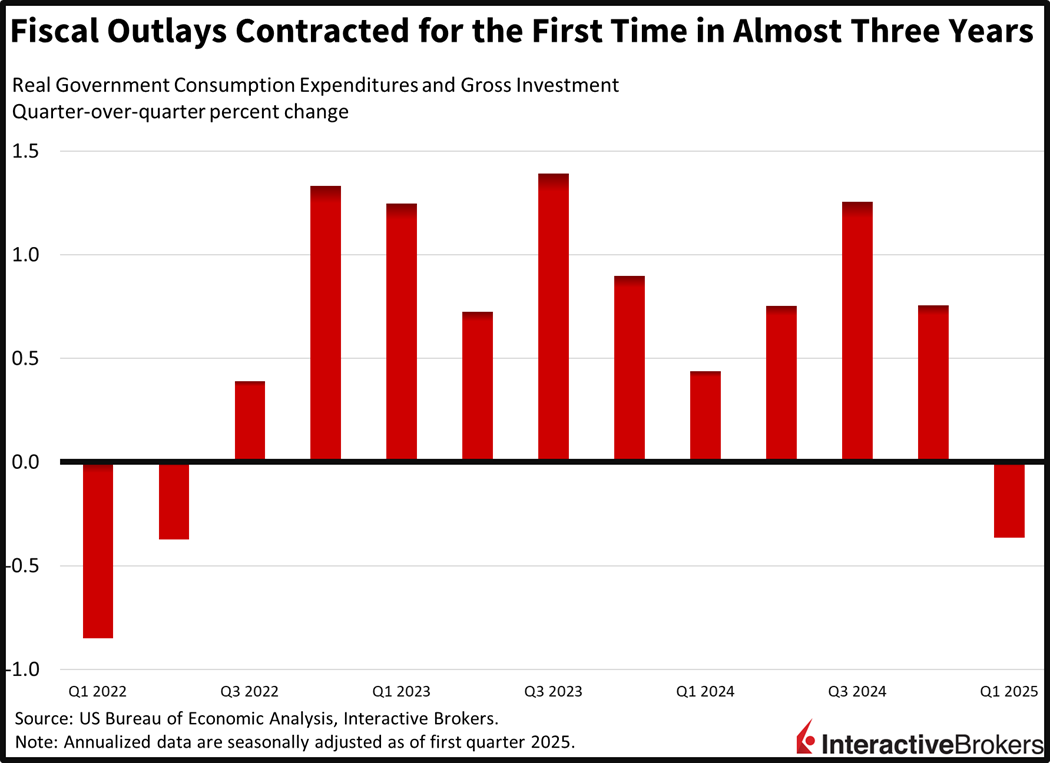
A surge in imports ahead of the April 2 Trump Tariffs led to a negative gross domestic product (GDP) print to begin the year, overwhelming the positive contributions from robust business investment, consumer spending and exports. Reduced government spending also weighed on the headline. First-quarter real GDP contracted 0.3% on an annualized, quarter-over-quarter (q/q) basis, well below the median estimate of 0.4% and the fourth quarter’s 2.4% pace of growth. It was the first subtraction since the initial three months of 2022.
Consumers Slow Spending
Consumer spending decelerated to its slowest pace of growth since the second quarter of 2023, coming in at 1.8%, as outlays slowed for durable goods and at more modest degrees, non-durables and services. But private domestic investment surged to a rate of 21.8%, bolstered by enormous business initiatives, inventories and to a much lesser extent residential capital expenditures. It was the fastest clip in over three years, or since the final quarter of 2021. Taken together, investment and consumption added 3.6% and 1.2% to the headline, but the 5% subtraction from imports and the 0.3% drag from government budget cuts countered those gains. Meanwhile, a 0.2% positive contribution from exports wasn’t enough to flip the number above 0.
But Spent More in March
While the GDP report depicts a slow first quarter regarding household consumption, today’s personal income and outlays print shows consumers came out in force last month. Spending volumes expanded a whopping 0.7% m/m, equal to dollars spent since prices were flat during the month. Consumer expenditures were much firmer than the 0.5% expected and February’s real expansion of just 0.1%. An increase of only 0.5% in incomes, however, caused a decline in the personal savings rate as shopping was increasingly upbeat, with the metric sinking from 4.1% to 3.9% m/m.
March Price Pressures Were Contained
Inflationary pressures were in control last month with the overall and core personal consumption expenditures (PCE) price indices reflecting no change. Declines in durable and non-durable good charges of 0.1% and 0.7% countered the 0.2% m/m advance in services costs. And a 0.5% increase in food prices was offset by a 2.7% drop in energy goods and services. The annualized figures across headline and core advanced 2.3% and 2.6% y/y, slowing from 2.7% and 3% in February. While the 2.6% was in-line with projections, the 2.3% number was a tenth of a percent higher than estimates.
Hiring Slows
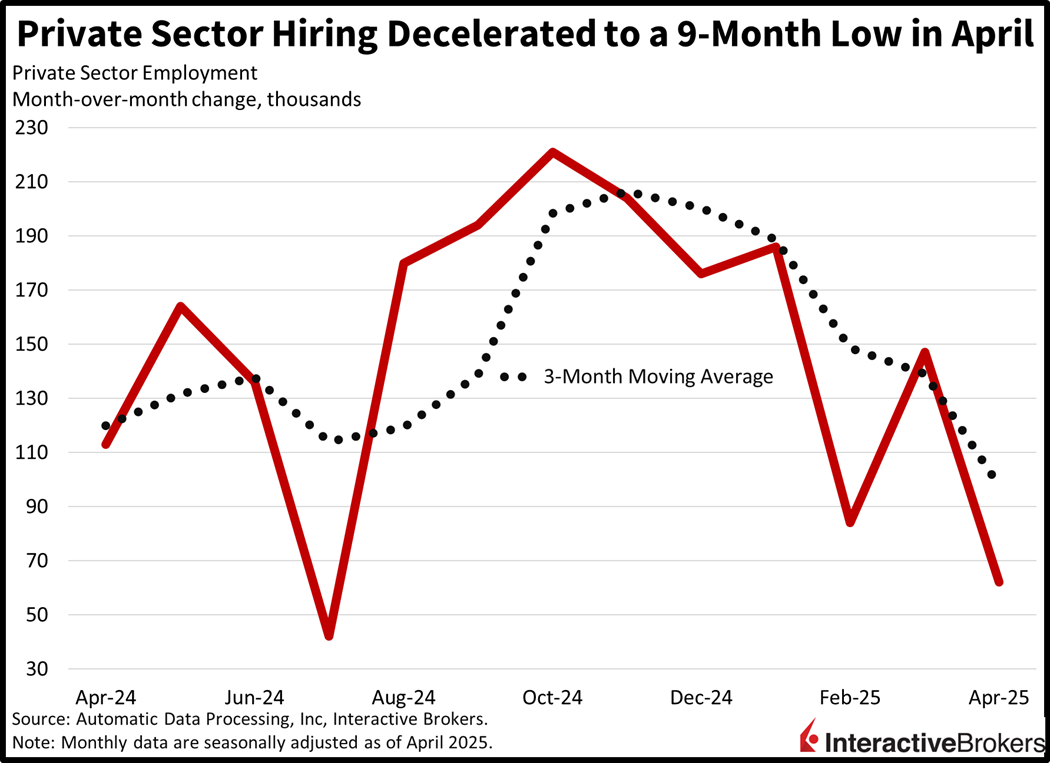
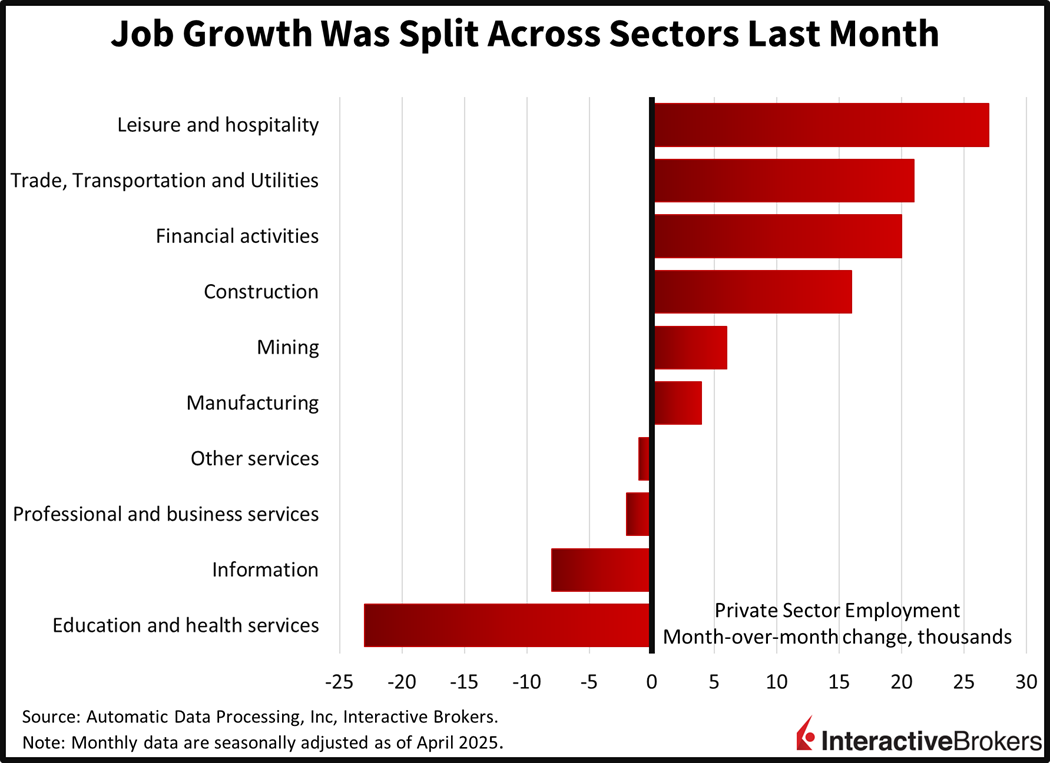
Private sector hiring expanded at its slowest rate in nine months during April amidst job losses in 4 out of 10 sectors. The 62,000 headcount additions came in beneath the median estimate of 115,000 and March’s 147,000. Weighing on performance were roster reductions in the education/health, information, professional/business services and other services segments, which lost 24,000, 8,000, 2,000 and 1,000 net positions. But the leisure/hospitality, trade/transportation/utilities, financial activities, construction, natural resources/mining and manufacturing groups gained 27,000, 21,000, 20,000, 16,000, 6,000 and 4,000. Across establishment sizes, medium-sized companies (50-499 employees) added 40,000 workers, while small and large enlarged payrolls by 11,000 and 12,000, respectively. Compensation trends were bifurcated with the y/y change in annual pay shifting from 6.7% and 4.6% for job stayers and job changers, to 6.9% and 4.5% this month.
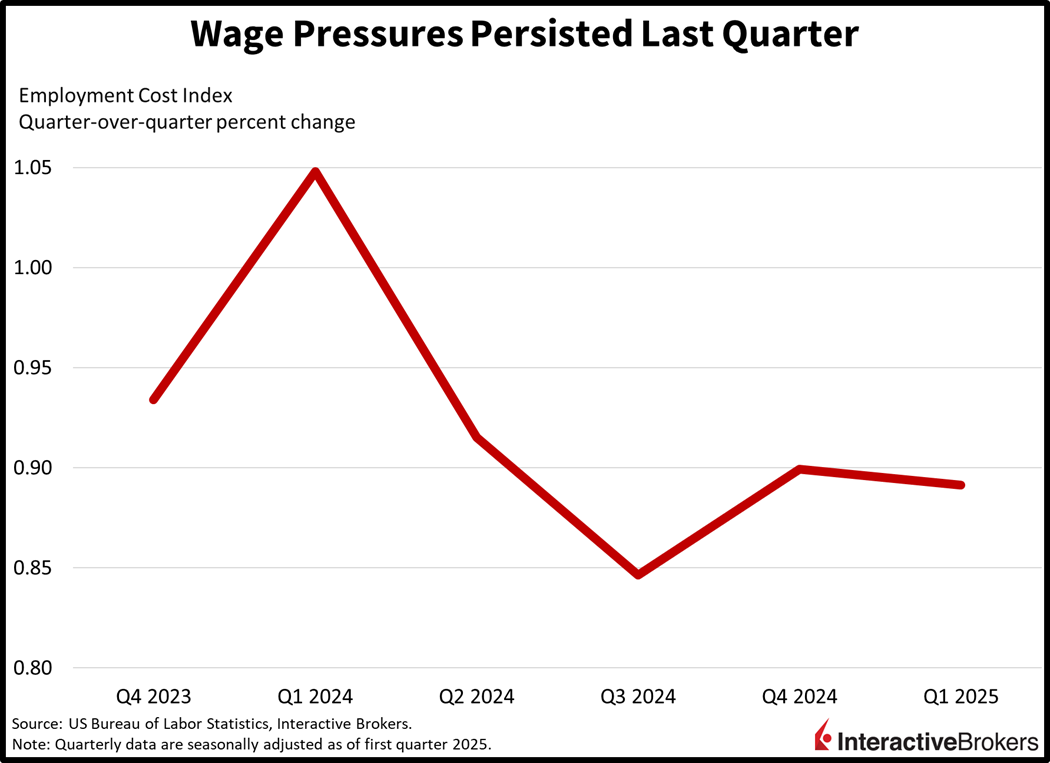
Compensation Costs Increase
Compensation burdens climbed with the employment cost index (ECI) expanding 0.9% on a q/q basis to begin the year, matching estimates and the rate of the final three months of 2024. Benefit expenses advanced 1.2% q/q while wages rose only 0.8%. Trends were similar across public and private sector workers, with their packages growing 0.9% and 0.8% during the period. Meanwhile inflation didn’t decrease purchasing power for employees in the past year, with the constant dollar ECI climbing 1.2% year over year (y/y), accelerating from 0.8% in the preceding quarter.
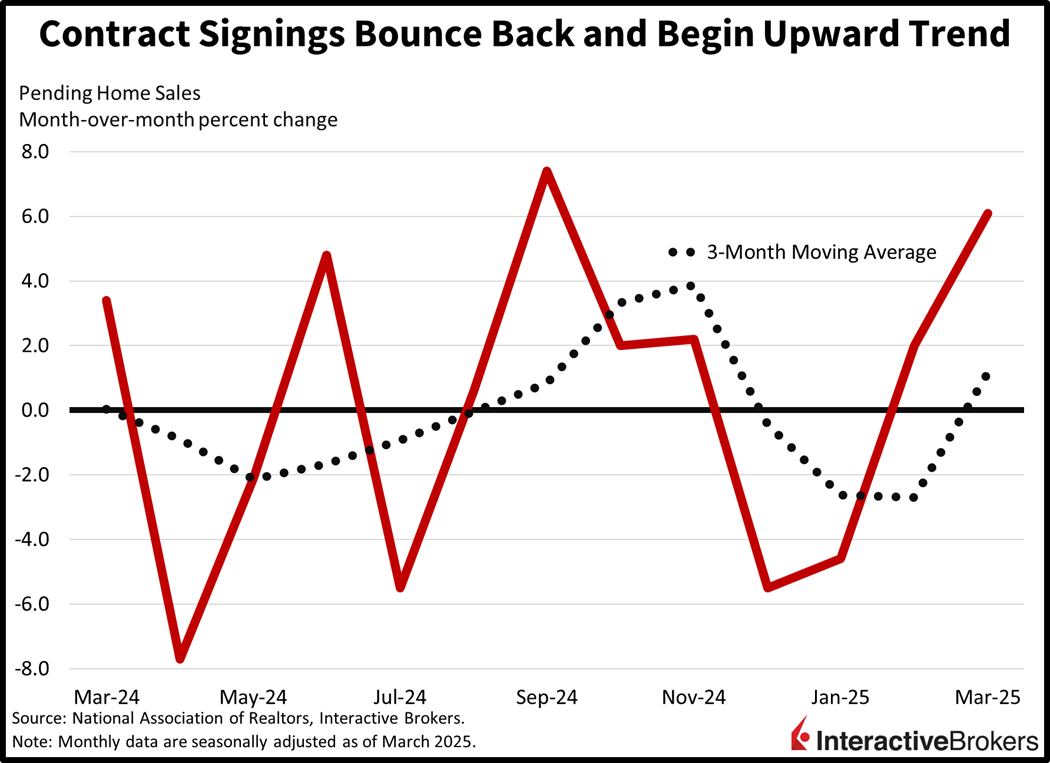
Home Buying Contracts Surge
Residential contract signings surged last month as the spring home buying season commenced. Pending home sales jumped 6.1% m/m in March, well above the 1% expectation and the 2.1% from February. Regional participation was broad, with just the Northeast sporting a negative of 0.5% m/m. The South, Midwest and West increased 9.8%, 4.9% and 4.8%, meanwhile. Contract agreements aren’t a guarantee of closed sales folks, but they do serve as a leading indicator of completed transactions, since paperwork is usually signed 30 days before keys are exchanged.
Windy City Conditions Weaken
The Chicago Business Barometer, also known as the Chicago PMI, weakened to 44.6 this month. Forecasters expected a figure closer to 45.5, which would’ve still marked a decline from March’s 47.6. The contraction-expansion threshold lies at 50.
Markets Climb from Morning Lows
Markets are off their morning lows and are shrugging off the negative GDP report, which was driven by a rush in imports. Still, all major equity benchmarks are lower with the Russell 2000, Nasdaq 100, S&P 500 and Dow Jones Industrial gauges down 1.2%, 1.2%, 0.9% and 0.6%. All eleven sectors are retreating, and the losses are being led by energy, consumer discretionary and communication services, which are in the red by 2.2%, 2.1% and 1.1%. Treasuries and the greenback are catching bids, however, as the 2- and 10-year maturities change hands at 3.61% and 4.17%, 5 and 1 basis point (bps) lighter on the session while the US Dollar Index rises 41 bps. The American currency is appreciating relative to most of its major counterparts including the euro, pound sterling, franc, yen and yuan but it is depreciating against the loonie and Aussie tender. All commodity majors are being trimmed with copper, lumber, silver, gold and crude oil sinking 5.1%, 0.6%, 0.6%, 0.3% and 0.1%.
A Few Billions Here, A Few Billions There
President Trump’s common talking points referring to the billions of dollars the country is attracting and the billions that firms are investing over here and the other billions for a few factories over there made their way into the data in force this morning. In fact, when you consider that a one-time import surge occurring to front run April 2 Trump tariffs subtracted 5% from GDP in the first quarter, a 0.3% contraction is not that bad. Consumer outlays and domestic investment were buoyant, and government spending was weak, aligning with the goals of the administration that is seeking private-sector growth rather than deficit-fueled expansions. Now that the preliminary read of first-quarter economic performance is behind us, however, the focus for policymakers should be to capitalize on those robust capital expenditures via high-income hiring supporting a manufacturing renaissance, growing corporate profits, greater export volumes and broad economic diversity for the USA across both goods and services production.
International Roundup
Europe Posts Stronger-Than-Expected Growth
The euro zone economy grew 0.4% during the first quarter, according to preliminary data from Eurostat. The result exceeded the median expectation for expansion to match the 0.2% pace of the last three months of 2024. Ireland, which experiences considerable variations in results because of its strong exposure to multinational companies, led with gross domestic product expanding 3.2%. Spain and Lithuania were the second and third strongest countries, with both posting rates of 0.6%. Germany, the euro zone’s largest economy, however, grew only 0.2%.
Canada’s Economy Contracts
Just one day after Canada’s Liberal Party’s Mark Carney won the election for prime minister, the country has received a sobering report that GDP sank 0.2% in February, a reverse from its 0.4% growth in January and missing the analyst consensus estimate for a flat result.
China PMI Weakens
China’s economy continued to slow this month, according to two different providers of Purchasing Managers’ indices (PMI). The National Bureau of Statistics last night reported that its manufacturing and non-manufacturing PMI gauges fell from 50.5 and 50.8 in March to 49.0 and 50.4. The indicators fell below the median analyst estimates of 49.8 and 50.7 and the manufacturing gauge, which has an expansion/contraction threshold of 50, depicted contracting activity.
Separately, the S&P Caixin Manufacturing PMI also showed slowing activity with a decline from 51.2 in March to 50.4 this month. It surpassed the analyst forecast of 49.8, however.
South Korea’s Industry Picks Up
South Korea’s industrial production grew 2.9% m/m in March, accelerating from 1.4% in the preceding month and exceeding economists’ forecast of 0.2%. Compared to the same month of 2024, however, production slowed from 7.1% in February to 5.3% but still outpaced the forecast of 3.3%.
Disclosure: Interactive Brokers Affiliate
Information posted on IBKR Campus that is provided by third-parties does NOT constitute a recommendation that you should contract for the services of that third party. Third-party participants who contribute to IBKR Campus are independent of Interactive Brokers and Interactive Brokers does not make any representations or warranties concerning the services offered, their past or future performance, or the accuracy of the information provided by the third party. Past performance is no guarantee of future results.
This material is from IBKR Macroeconomics, an affiliate of Interactive Brokers LLC, and is being posted with its permission. The views expressed in this material are solely those of the author and/or IBKR Macroeconomics and Interactive Brokers is not endorsing or recommending any investment or trading discussed in the material. This material is not and should not be construed as an offer to buy or sell any security. It should not be construed as research or investment advice or a recommendation to buy, sell or hold any security or commodity. This material does not and is not intended to take into account the particular financial conditions, investment objectives or requirements of individual customers. Before acting on this material, you should consider whether it is suitable for your particular circumstances and, as necessary, seek professional advice.
