1/ Find Leadership
2/ A Deeper Dive
3/ Who’s Right this Time?
Investopedia is partnering with CMT Association on this newsletter. The contents of this newsletter are for informational and educational purposes only, however, and do not constitute investing advice. The guest authors, which may sell research to investors, and may trade or hold positions in securities mentioned herein do not represent the views of CMT Association or Investopedia. Please consult a financial advisor for investment recommendations and services.
1/
Find Leadership
One recent tool that many technicians have adopted is called Relative Rotation Graphs (RRG graphs) for short. This visual representation of momentum and strength in a security compared to a benchmark is a valuable tool for portfolio positioning. Invented by Julius de Kempenaer, RRGs combine two indicators of relative momentum and strength. JDK RS-Momentum measures the speed of a securities movement vs. the benchmark, while JDK Relative Strength-Ratio indicates its outperformance compared to it. By comparing these two indicators against a benchmark, we can observe the security’s rotation from higher momentum and outperformance to lower momentum and underperformance. The four quadrants of the RRG graph—Improving, Leading, Weakening, and Lagging—indicate the security’s phase relative to the benchmark. These quadrants can be utilized in portfolio positioning to identify potential opportunities within a market.
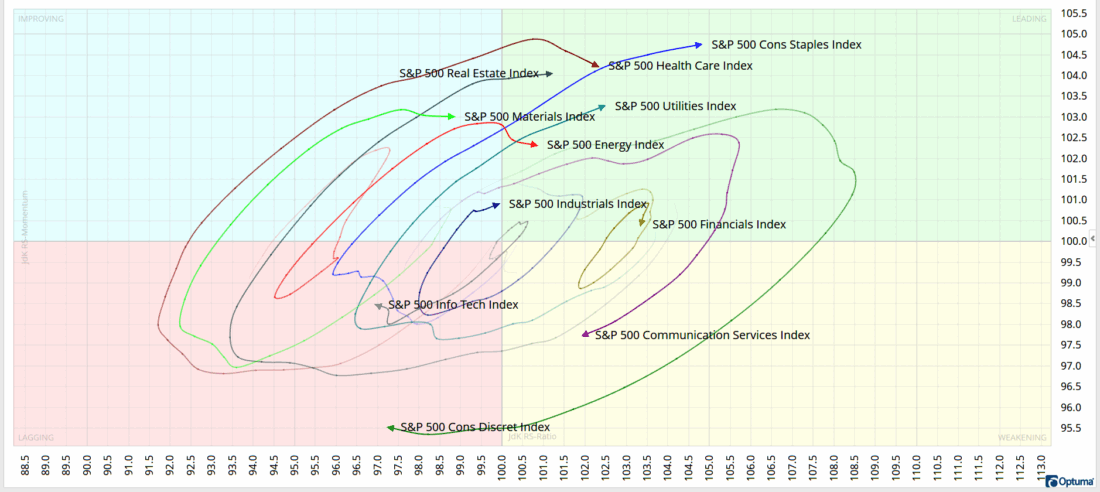
Currently, the Consumer Staples sector is exhibiting relative strength and momentum compared to the S&P 500, moving into the leading quadrant. Conversely, the Consumer Discretionary sector is losing momentum and strength, moving deeper into the lagging quadrant. This trend aligns with the recent risk-off reaction to tariff announcements that have disrupted the markets.
In this graph, I used 26-week tails to analyze the position of each sector relative to the S&P 500 over that period. Examining the tails reveals the rotation from the Consumer Discretionary sector’s outperformance to underperformance during that timeframe. These tails are helpful in being able to visualize the actual rotation within the market. The Utility sector, on the other hand, continues to advance into the leading quadrant, prompting a closer look at its constituents.
2/
A Deeper Dive
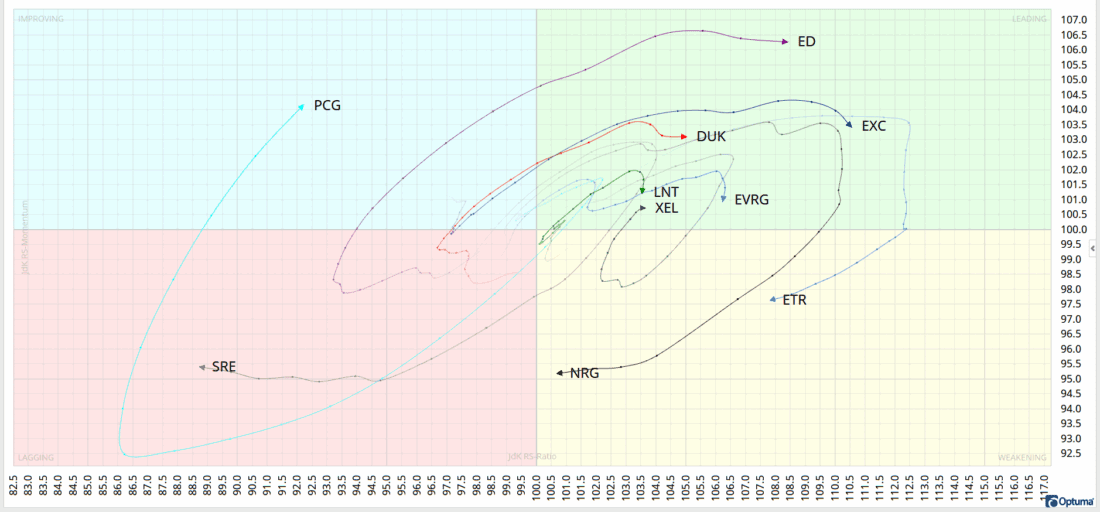
Once you’ve identified a sector showing leadership in the market, you can delve deeper to find the individual companies within that sector that are outperforming their own sector. This approach helps pinpoint leadership by not only identifying the strongest sectors within an index but also the strongest companies within those sectors. For instance, the S&P 500 Utility sector is comprised of 31 companies. I’ve narrowed it down to 10 companies across all four quadrants of the RRG graph. Now, you can assess which of these 10 companies exhibits momentum and strength against the utility sector, in addition to the overall strength of the utility sector itself. While most constituents of a benchmark tend to follow a similar clockwise rotation around it, XEL shows us an exception. It has demonstrated the ability to avoid falling behind the benchmark with continued leadership throughout the 26-week timeframe. Currently, PCG is gaining momentum, moving from down to up on the graph, while EXC appears to be on a potential path of relative underperformance vs. the sector. By utilizing RRG graphs in this manner, you can gain insights into when to enter or exit a security, providing clear visual cues of momentum and strength.
3/
Who’s Right this Time?
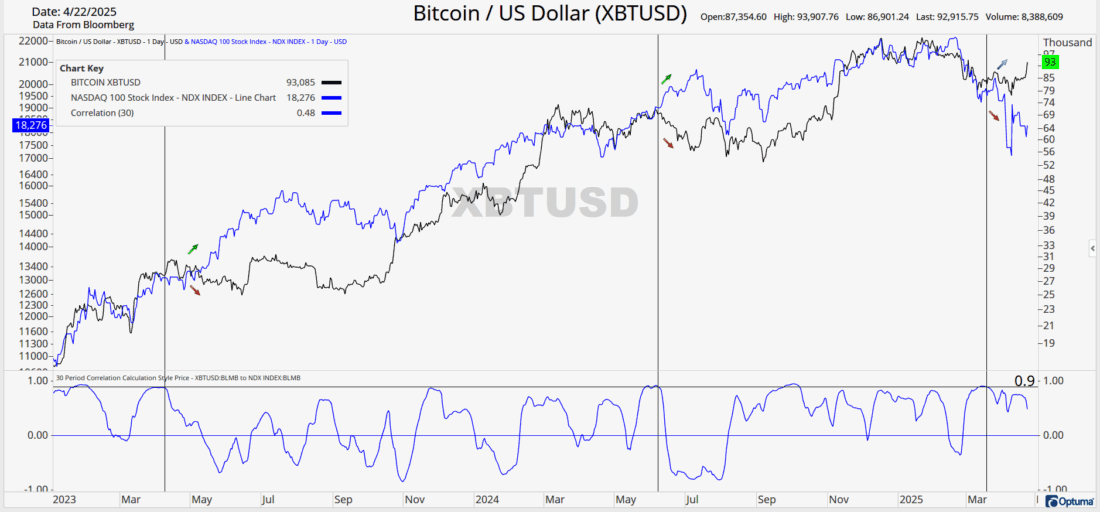
With the ongoing tariff turmoil weighing heavily on equities, it seems that Bitcoin has been somewhat unaware of the market turmoil. Despite a slight dip of approximately -2.1% year to date, Bitcoin’s highly volatile nature makes it unlikely that long-term holders would even notice such a small change. On the other hand, the Nasdaq has been struggling to regain its footing, having experienced a significant decline of -12.8% year to date.
Interestingly, Bitcoin is now beginning to show signs of upward movement, while the Nasdaq continues to consolidate and its trends appear to be worsening. This divergence is particularly noteworthy because it goes against patterns observed in the past. Since the beginning of 2023, Bitcoin and the Nasdaq have experienced Five instances where their 30-day price correlation has moved below 0.9. In three of these cases, price divergences followed. Notably, during April 2023 and June 2024, the Nasdaq continued to rise while Bitcoin declined.
—
Originally posted 23rd April 2025
Disclosure: Investopedia
Investopedia.com: The comments, opinions and analyses expressed herein are for informational purposes only and should not be considered individual investment advice or recommendations to invest in any security or to adopt any investment strategy. While we believe the information provided herein is reliable, we do not warrant its accuracy or completeness. The views and strategies described on our content may not be suitable for all investors. Because market and economic conditions are subject to rapid change, all comments, opinions and analyses contained within our content are rendered as of the date of the posting and may change without notice. The material is not intended as a complete analysis of every material fact regarding any country, region, market, industry, investment or strategy. This information is intended for US residents only.
Disclosure: Interactive Brokers Third Party
Information posted on IBKR Campus that is provided by third-parties does NOT constitute a recommendation that you should contract for the services of that third party. Third-party participants who contribute to IBKR Campus are independent of Interactive Brokers and Interactive Brokers does not make any representations or warranties concerning the services offered, their past or future performance, or the accuracy of the information provided by the third party. Past performance is no guarantee of future results.
This material is from Investopedia and is being posted with its permission. The views expressed in this material are solely those of the author and/or Investopedia and Interactive Brokers is not endorsing or recommending any investment or trading discussed in the material. This material is not and should not be construed as an offer to buy or sell any security. It should not be construed as research or investment advice or a recommendation to buy, sell or hold any security or commodity. This material does not and is not intended to take into account the particular financial conditions, investment objectives or requirements of individual customers. Before acting on this material, you should consider whether it is suitable for your particular circumstances and, as necessary, seek professional advice.
Disclosure: Forex
There is a substantial risk of loss in foreign exchange trading. The settlement date of foreign exchange trades can vary due to time zone differences and bank holidays. When trading across foreign exchange markets, this may necessitate borrowing funds to settle foreign exchange trades. The interest rate on borrowed funds must be considered when computing the cost of trades across multiple markets.
Disclosure: Cryptocurrency based Exchange Traded Products (ETPs)
Cryptocurrency based Exchange Traded Products (ETPs) are high risk and speculative. Cryptocurrency ETPs are not suitable for all investors. You may lose your entire investment. For more information please view the RISK DISCLOSURE REGARDING COMPLEX OR LEVERAGED EXCHANGE TRADED PRODUCTS.
