1/ Mosaic Breaks Downtrend Line Ahead of Earnings
2/ Kroger Shows How 1988 Still Matters
3/ CNP’s Rally Stretches: Time for a Pullback?
Investopedia is partnering with CMT Association on this newsletter. The contents of this newsletter are for informational and educational purposes only, however, and do not constitute investing advice. The guest authors, which may sell research to investors, and may trade or hold positions in securities mentioned herein do not represent the views of CMT Association or Investopedia. Please consult a financial advisor for investment recommendations and services.
1/
Mosaic Breaks Downtrend Line Ahead of Earnings
The weekly chart of Mosaic Company (MOS) reveals an important technical development just as the company heads into its earnings report.
Mosaic has been in a prolonged downtrend since its April 2022 high, but the price action shows signs of life just ahead of this week’s earnings report.
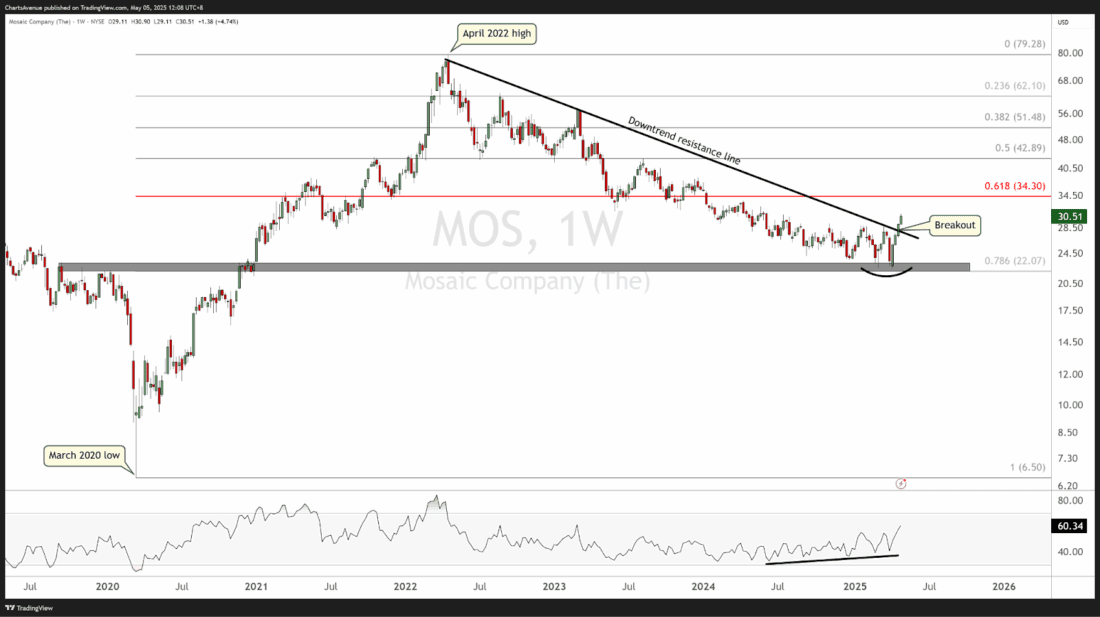
The chart shows that MOS recently bounced near the 78.6% Fibonacci retracement of its March 2020 to April 2022 rally, around $22. This bounce was significant as it pushed the price above its long standing downtrend resistance line.
Interestingly, while price made lower lows during this recent leg down, the Relative Strength Index (RSI) formed higher lows since July 2024, creating a bullish divergence. This signals weakening downside momentum and possibly a reversal of the current (down-)trend.
Bottom Line: The breakout above the downtrend line, combined with bullish divergence on the RSI, hints at a potential trend shift. However, the upcoming earnings could be a key catalyst that determines whether this breakout holds or fails.
2/
Kroger Shows How 1988 Still Matters
The monthly chart of Kroger (KR) reveals a remarkable long-term pattern where price levels from 1988 continue to guide today’s market price action.
The October 1988 high and December 1988 low provide the base for the Fibonacci extension levels plotted on the chart. Fast-forward nearly four decades, and KR has now hit its 11.09 Fibonacci extension target around $71, underscoring how long-term technical analysis can remain relevant.
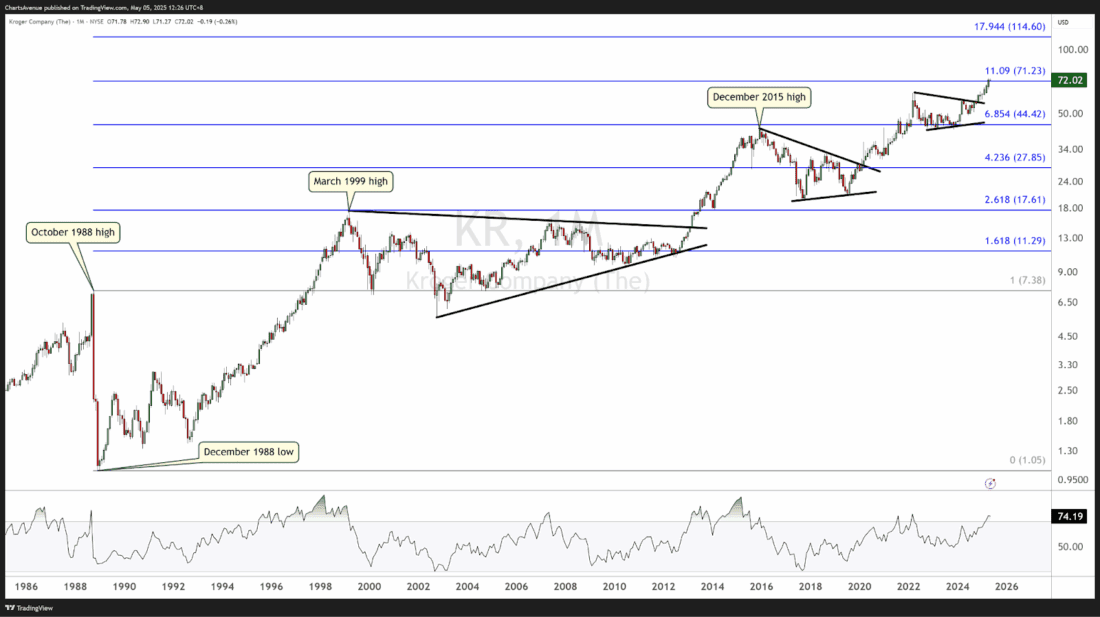
One can also notice how Kroger repeatedly formed the same type of consolidation pattern below key highs (notably in March 1999 and December 2015).
Currently, as the RSI has not yet risen to overbought territory (above 70) the price might still have momentum to continue its uptrend towards its next Fibonacci level.
2/
CNP’s Rally Stretches: Time for a Pullback?
The daily chart of CenterPoint Energy (CNP) shows a strong and accelerating uptrend. CNP first broke above its 200-day Exponential Moving Average (EMA) in Q4 2024, a classic bullish signal. Since then, the price bounced off first on its 200-day EMA, then, on its next pullback hugged its 100-day EMA, followed by the next retracement towards its 50-day EMA and finally on its 21-day EMA, showing that the accumulation is intensifying.
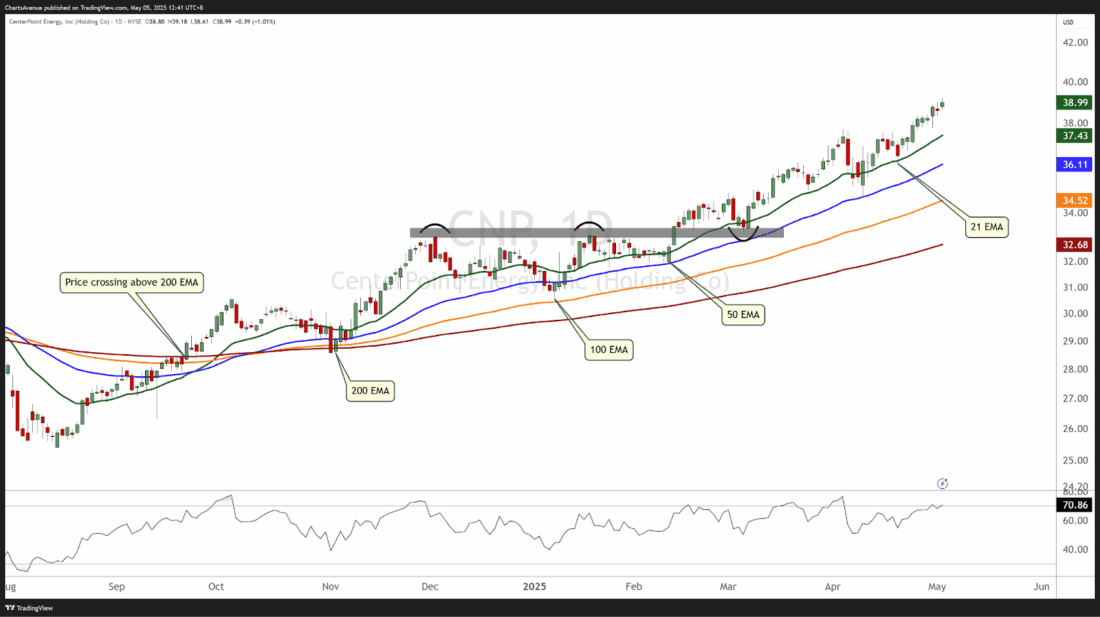
However, the trend may be getting overheated. Historically, steep trends often pause or pull back to digest gains before resuming higher.
Conclusion:
CNP’s trend remains decisively bullish, supported by the alignment of the 21, 50, 100, and 200 EMAs, stacked from top to bottom, which is textbook bullish. But with the current price getting away from its closest Exponential Moving Average, and each EMA getting further from each other, i.e. accelerating uptrend, one may consider waiting for a pullback, ideally towards the 21 or 50 EMA area, before entering a new long position.
—
Originally posted 6th May 2025
Disclosure: Investopedia
Investopedia.com: The comments, opinions and analyses expressed herein are for informational purposes only and should not be considered individual investment advice or recommendations to invest in any security or to adopt any investment strategy. While we believe the information provided herein is reliable, we do not warrant its accuracy or completeness. The views and strategies described on our content may not be suitable for all investors. Because market and economic conditions are subject to rapid change, all comments, opinions and analyses contained within our content are rendered as of the date of the posting and may change without notice. The material is not intended as a complete analysis of every material fact regarding any country, region, market, industry, investment or strategy. This information is intended for US residents only.
Disclosure: Interactive Brokers Third Party
Information posted on IBKR Campus that is provided by third-parties does NOT constitute a recommendation that you should contract for the services of that third party. Third-party participants who contribute to IBKR Campus are independent of Interactive Brokers and Interactive Brokers does not make any representations or warranties concerning the services offered, their past or future performance, or the accuracy of the information provided by the third party. Past performance is no guarantee of future results.
This material is from Investopedia and is being posted with its permission. The views expressed in this material are solely those of the author and/or Investopedia and Interactive Brokers is not endorsing or recommending any investment or trading discussed in the material. This material is not and should not be construed as an offer to buy or sell any security. It should not be construed as research or investment advice or a recommendation to buy, sell or hold any security or commodity. This material does not and is not intended to take into account the particular financial conditions, investment objectives or requirements of individual customers. Before acting on this material, you should consider whether it is suitable for your particular circumstances and, as necessary, seek professional advice.
