1/ Headline Risk is Real
2/ Where are the Ducks “Heading?”
3/ Big day for Consumer Discretionary
Investopedia is partnering with CMT Association on this newsletter. The contents of this newsletter are for informational and educational purposes only, however, and do not constitute investing advice. The guest authors, which may sell research to investors, and may trade or hold positions in securities mentioned herein do not represent the views of CMT Association or Investopedia. Please consult a financial advisor for investment recommendations and services.
1/
Headline Risk is Real
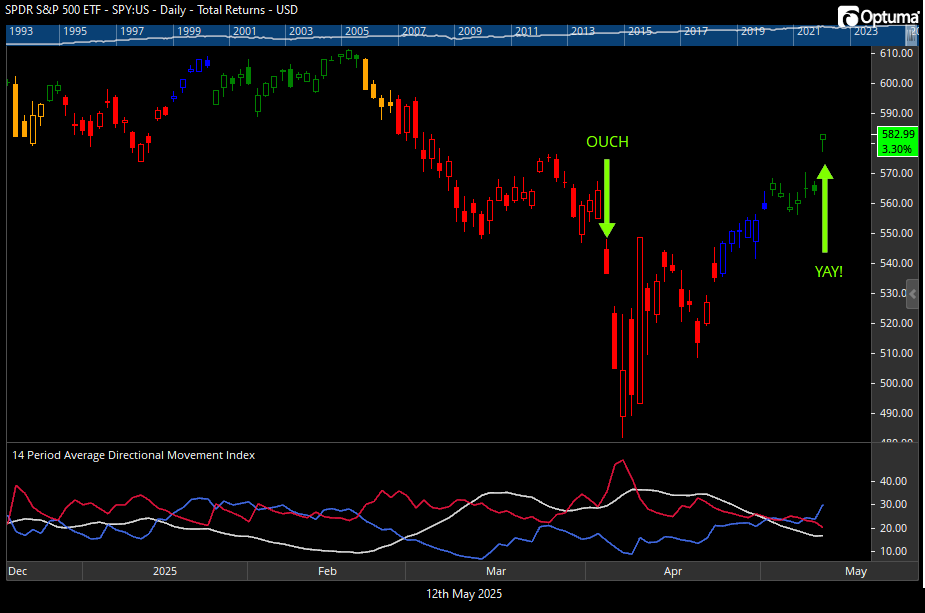
Headline Risk – when you can throw all your technical and fundamental factors away because the news can completely override all currently available information about the stock market. Sometimes the headlines are good (like today) and sometimes they make you re-consider everything (think the day after the tariffs were announced…OUCH).
Two things to note about that recent OUCH moment in April – trend was already not looking good. The Directional Movement Index (shown below) was already showing that sellers were in control (Red line is above Blue) and the candle bars were already Red (showing RRG Trend). However, the three days leading up to the April sell-off gave some false hope that the market could be turning around…before smacking us all upside the head.
As for the YAY! Moment (today), the candles (RRG Trend) were already Green and Directional Movement had recently turned positive (Blue line is above Red). But in either case, the news that triggered these moves wasn’t expected. Today’s positive news about tariff negotiations could have gone bad in the same amount but in the other direction.

2/
Where are the Ducks “Heading?”
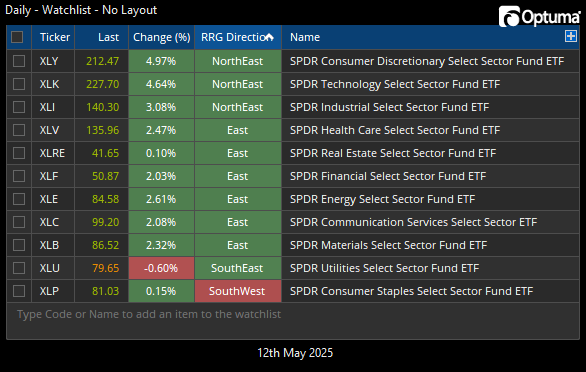
When looking at the S&P 500 sectors on RRG charts, I find several items worth noting. First, I note not only which quadrant (Lagging, Improving, etc.) the “ducks” are in, but also where (in which direction) the “ducks” are heading. This can give a decent heads-up on when a sector, index, or stock might be coming in (or going out) of favor.
In Optuma, I have the current direction listed as a heading (RRG Direction) and colored Green or Red, depending on the current direction of each sector. (Not shown today, I also can have Blue or Orange if a sector is starting its transition from Green to Red or vice versa.)
Mathew Verdouw from Optuma wrote a white paper on this back in 2016 that is worth checking out. TL;DR – It showed that a 45 degree angle (NorthEast heading) is a solid starting point to go shopping for: in this case, a sector to buy.
But let’s take this further. Which of these “ducks” have the best headings right now? Consumer Discretionary (XLY), Technology (XLK), Industrials (XLI), Financials (XLF), and Communications (XLC). The sectors that we’d consider “Growth” are all leading: XLK, XLC, & XLY. While all the “Defensive” names are ranked lower: XLV, XLP, XLU, XLRE. And the “Value” names are split: XLI and XLF vs XLE and XLB.
Growth tends to lead the market, in both directions, so this group is worth watching. And right now, they are all looking good.

3/
Big day for Consumer Discretionary
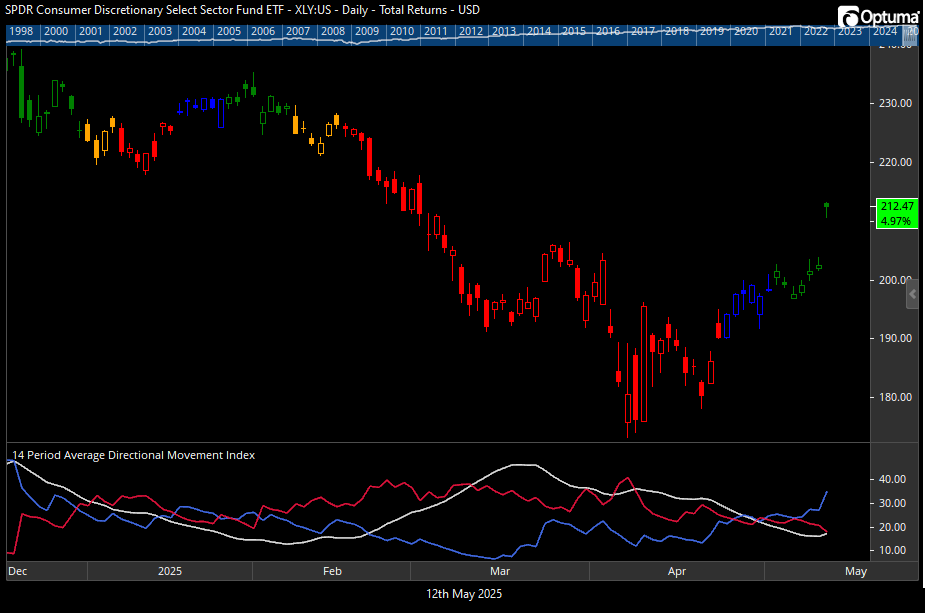
This is one of those days when I’m flipping through the performance results of the Sector ETFs and I notice one that jumps way out of the average. While many Sector ETFs were showing a positive 2%+, the Consumer Discretionary sector shows being up almost 5% today. Wow, that is quite a gap upward.
So what drove that? The top holding is Amazon (AMZN), which was up 8.07% today. Also, Tesla (TSLA) was up 6.75%. Yeah, that will help. Just these two stocks make up just over 38% of this index. The next top holdings in this index all looked similar to the other sectors. What a difference just a few holdings can make!

While a somewhat surprise up-day in the market is always welcome, I’m still keeping in mind the potential Seasonality issues that tend to appear in mid-May. There is also a “Bear” image in my Stock Trader’s Almanac for tomorrow, meaning a high-probability of a down day on May 13th. Those may be working together behind the scenes to give us some short-term volatility. And don’t forget that this Friday is options expiration.
The fun continues…
—
Originally posted 13th May 2025
Disclosure: Investopedia
Investopedia.com: The comments, opinions and analyses expressed herein are for informational purposes only and should not be considered individual investment advice or recommendations to invest in any security or to adopt any investment strategy. While we believe the information provided herein is reliable, we do not warrant its accuracy or completeness. The views and strategies described on our content may not be suitable for all investors. Because market and economic conditions are subject to rapid change, all comments, opinions and analyses contained within our content are rendered as of the date of the posting and may change without notice. The material is not intended as a complete analysis of every material fact regarding any country, region, market, industry, investment or strategy. This information is intended for US residents only.
Disclosure: Interactive Brokers Third Party
Information posted on IBKR Campus that is provided by third-parties does NOT constitute a recommendation that you should contract for the services of that third party. Third-party participants who contribute to IBKR Campus are independent of Interactive Brokers and Interactive Brokers does not make any representations or warranties concerning the services offered, their past or future performance, or the accuracy of the information provided by the third party. Past performance is no guarantee of future results.
This material is from Investopedia and is being posted with its permission. The views expressed in this material are solely those of the author and/or Investopedia and Interactive Brokers is not endorsing or recommending any investment or trading discussed in the material. This material is not and should not be construed as an offer to buy or sell any security. It should not be construed as research or investment advice or a recommendation to buy, sell or hold any security or commodity. This material does not and is not intended to take into account the particular financial conditions, investment objectives or requirements of individual customers. Before acting on this material, you should consider whether it is suitable for your particular circumstances and, as necessary, seek professional advice.
Disclosure: ETFs
Any discussion or mention of an ETF is not to be construed as recommendation, promotion or solicitation. All investors should review and consider associated investment risks, charges and expenses of the investment company or fund prior to investing. Before acting on this material, you should consider whether it is suitable for your particular circumstances and, as necessary, seek professional advice.

