Investopedia is partnering with CMT Association on this newsletter. The contents of this newsletter are for informational and educational purposes only, however, and do not constitute investing advice. The guest authors, which may sell research to investors, and may trade or hold positions in securities mentioned herein do not represent the views of CMT Association or Investopedia. Please consult a financial advisor for investment recommendations and services.
1/Copper Futures
There is added text today in COPPER FUTURES.
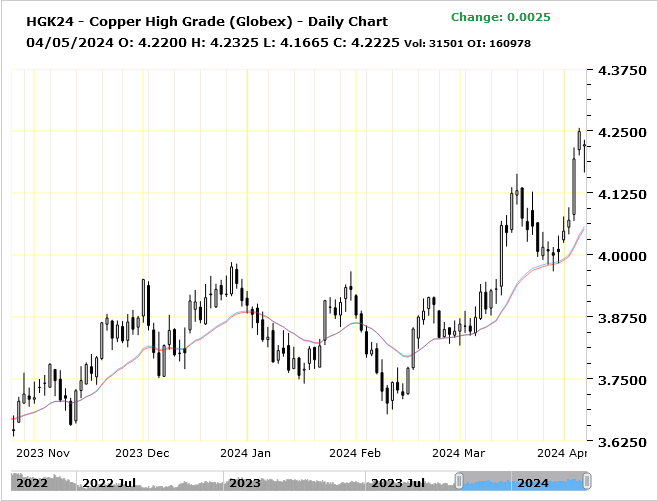
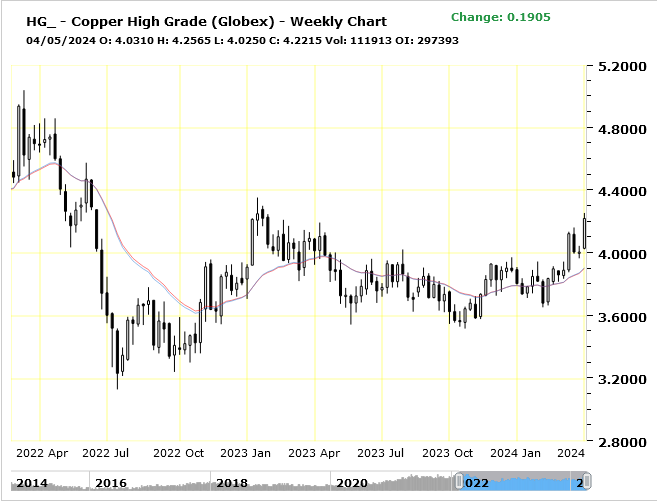
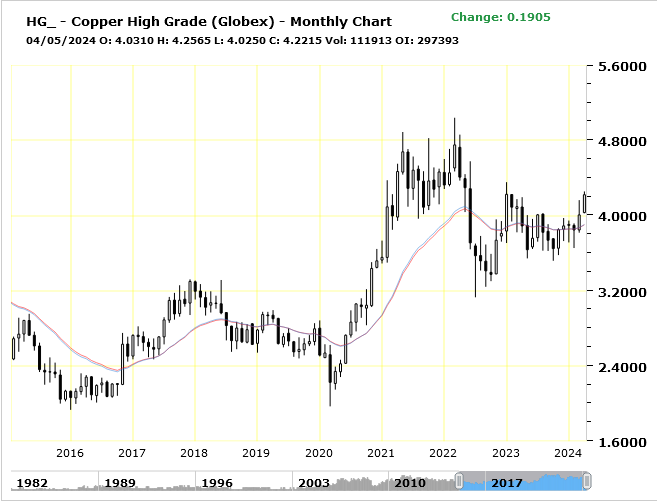
MAY COPPER FUTURES: On March 13th we stated that trade is moving through the January 2024 highs supply and resistance we pointed out. As noted, Prices are presently challenging the critical August 2023 highs that we also noted. A close above the August highs on a weekly basis and the January 2023 highs should be the next target—on March 18th we stated that the August highs have been closed upon and the January 2023 high is the target. Trade is presently on track to challenge the January 23 highs—please note the Copper weekly and monthly charts. Please see below our past accurate commentary regarding these supply and resistance levels.
We stated on January 2nd, 2024, that there is supply occurring in the weekly charts. A lower weekly close versus last week’s close portends lower prices, this action occurred on Friday January 5th. On August 11th we pointed out that we stated on July 14th and July 24th that Prices are moving higher as forecasted and is challenging the week of June 20th’s supply and resistance. As previously noted, the Bears have made their mark at these highs and the Bulls need to close above this high on a weekly basis to take back control of the trend. On July 24th we stated that Supply/Sellers have protected these highs and resistance. The supply and resistance at the June 20th highs have held and now last week’s August 7th’s high is resistance! Previously, on February 24th we stated that that Copper’s trade would move lower. We last stated that there is weekly supply entering this market, and if trade closes on a weekly basis below last week’s low–a leg lower should develop. This action occurred on Friday February 24th.
2/Charts
3/Defining Traps
The Beanpot Trap is a Proprietary Sentiment Indicator using a novel approach to Predictive Behavioral Analysis. The Market’s participant’s collective behavior is identified (proprietary supply and demand) which generates detectable behavioral patterns that are accurately forecasted for price direction. If you know why a factor works you should know with high probability when the factor should work! Throughout the years, covered market highs and lows leading to Bull and Bear Cyclical and Secular markets have been called in the PowerPlay utilizing the Beanpot Trap.
Definition of a Trap: the trap usually occurs in a very oversold or overbought condition. The market that is highlighted in the PowerPlay should move higher for a few days or weeks in an oversold condition or moves lower for a few days or weeks in an overbought condition, while Proprietary Capital Flow– Supply/Sellers or Demand/Buyers enters the marketplace. Trade is always in great shape above this new demand in an uptrend or it is always in great shape below this new supply in a downtrend; however, if trade takes out the proprietary demand/buyers in an
uptrend or proprietary supply/sellers in a down trend, the structure of the markets have changed leading to profound negative outcomes to the existing trend. If the demand/buyers get taken out, a long squeeze (much lower prices) should follow and if the supply/sellers get taken out, a short squeeze (much higher prices) should follow. It’s trapping the weak longs or weak shorts into a situation where they must dump their positions…a squeeze play should manifest leading to additional selling and buying by other market participants.
The Delayed Whistled Trap is a Proprietary Sentiment Trap Indicator but the outcome of the Trap that has been activated is delayed. We have mentioned the following scenario numerous times in the PowerPlay. Often times the influence of a Trap is seen immediately, as weak shorts or weak longs are forced to exit their positions and a flash move in a direction occurs and at times the directional move is more subtle. If a demand area get taken out in an overbought region but price fails to immediately move
lower, the next supply area to enter the market place should now be most important (the Tell) as the bears should add supply and the question that follows should be…should this added supply keep weighing on the market or should the bulls push through and take back control of the market…we have witnessed that many
market tops should experience this subtle developed pattern…we call this sentiment indicator a Delayed Whistled Trap.
The SP 500 Model Portfolio of Stocks SP 500 Model Portfolio of Stocks is a sentiment
Indicator consisting of 20 Large Cap Stocks. If an X is displayed on our SPX Chart on a low day, the X denotes that at least 13 out of 20 stocks that day are in accumulation/demand mode or if an X is displayed at a high day, the X denotes distribution/supply mode, two XX’s denotes that at least 20 Stocks in a two day period cumulative are experiencing accumulation/demand or distribution/supply or three XXX’s denotes that 25 stocks in a three day period cumulative, are experiencing an accumulation/demand or distribution/supply day. This indicator allows you to see buyers and sellers entering and exiting the market place, a commercial footprint. Strong directional moves are likely to follow.
—-
Originally posted 5th April, 2024
Disclosure: Investopedia
Investopedia.com: The comments, opinions and analyses expressed herein are for informational purposes only and should not be considered individual investment advice or recommendations to invest in any security or to adopt any investment strategy. While we believe the information provided herein is reliable, we do not warrant its accuracy or completeness. The views and strategies described on our content may not be suitable for all investors. Because market and economic conditions are subject to rapid change, all comments, opinions and analyses contained within our content are rendered as of the date of the posting and may change without notice. The material is not intended as a complete analysis of every material fact regarding any country, region, market, industry, investment or strategy. This information is intended for US residents only.
Disclosure: Interactive Brokers
Information posted on IBKR Campus that is provided by third-parties does NOT constitute a recommendation that you should contract for the services of that third party. Third-party participants who contribute to IBKR Campus are independent of Interactive Brokers and Interactive Brokers does not make any representations or warranties concerning the services offered, their past or future performance, or the accuracy of the information provided by the third party. Past performance is no guarantee of future results.
This material is from Investopedia and is being posted with its permission. The views expressed in this material are solely those of the author and/or Investopedia and Interactive Brokers is not endorsing or recommending any investment or trading discussed in the material. This material is not and should not be construed as an offer to buy or sell any security. It should not be construed as research or investment advice or a recommendation to buy, sell or hold any security or commodity. This material does not and is not intended to take into account the particular financial conditions, investment objectives or requirements of individual customers. Before acting on this material, you should consider whether it is suitable for your particular circumstances and, as necessary, seek professional advice.
Disclosure: Futures Trading
Futures are not suitable for all investors. The amount you may lose may be greater than your initial investment. Before trading futures, please read the CFTC Risk Disclosure. A copy and additional information are available at ibkr.com.
