This week will be busy, and if you are taking time off, don’t. The news starts Monday afternoon and runs through Friday morning, and all of it will impact where stocks and rates go from here because if you forgot what kicked off the stock market rally, it is time for a refresher.
It happened three months ago when October ended and November began. The biggest reason for the rally was the massive easing of financial conditions, which was on par with the rate-cutting cycles witnessed in 2008 and 2020. I’m not sure, but today doesn’t seem as bad as those prior periods, and one could argue that the easing has been a bit extreme.
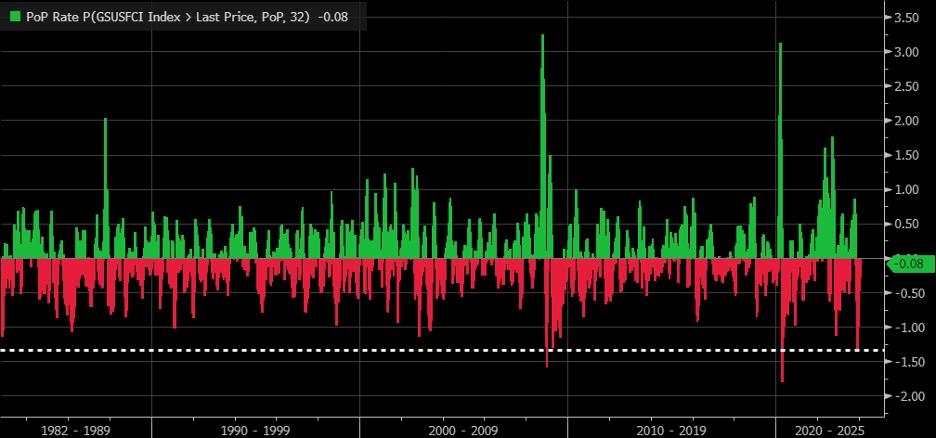
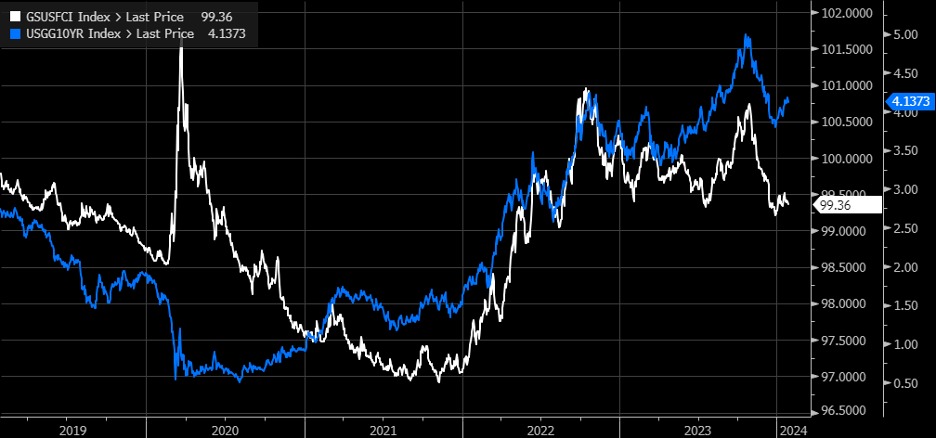
But don’t blame the easing of those conditions on Jay Powell. Blame the easing of financial conditions on Janet Yellen; you know, the former FOMC Chair who is now in charge of the US Treasury but still thinks she is in charge of the FOMC. That is because, on October 30, the Treasury announced it would need to borrow $76 billion less than originally noted. Then, on November 1, the Treasury decided to issue more of the government’s financial needs in Bills, shocking long-term rates lower. This started this risk-on rally as 10-year rates plunged, sparking a stock market rally for the ages, as a negative regime sparked a short-covering rally from negative and systematic flows jolting markets higher, bringing the volatility dispersion trade back to life, allowing all those calls in the “Troubling 3” Nvidia, Meta, and Microsoft to catch epic bids into January OPEX. This may have been good for my portfolio, but certainly not for my business overall since I had been bearish on the market and correctly so, noting that the summer rally was BS until Janet decided to flip the script on the bond market.
It is really hard to get into Janet’s head and know what it is she is thinking about, but Treasury noted back in October that:
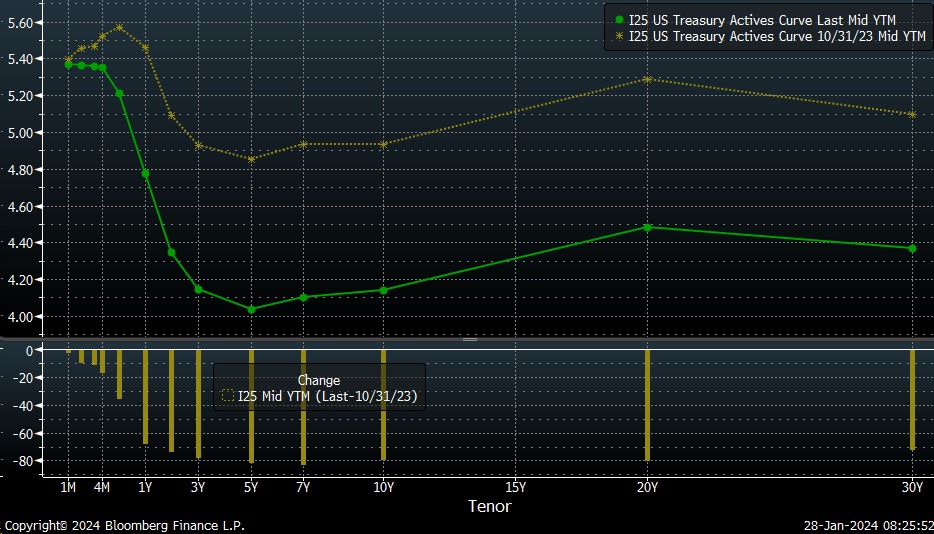
Will that number be less or higher? I have no idea. Will issuance be directed more to bills or bonds? I have no idea. On Monday afternoon, we start to find out when the Treasury will tell us how much needs to be borrowed. Then, on Wednesday morning, we will find out the form of the issuances, whether it means more bills or more notes and bonds. I can see pretty easily that the Treasury curve has fallen. More importantly, bill rates have also fallen, which may favor more duration being issued this time. Currently, T-bills are trading in line with the Fed’s overnight reverse repo rate.
I guess from a political standpoint, does Janet want to hold back some dry powder for later in the year, as the election nears, and do a massive easing of financial conditions over the summer months in case the economy begins to slow again, and opt to tighten financial conditions now only to ease them later?
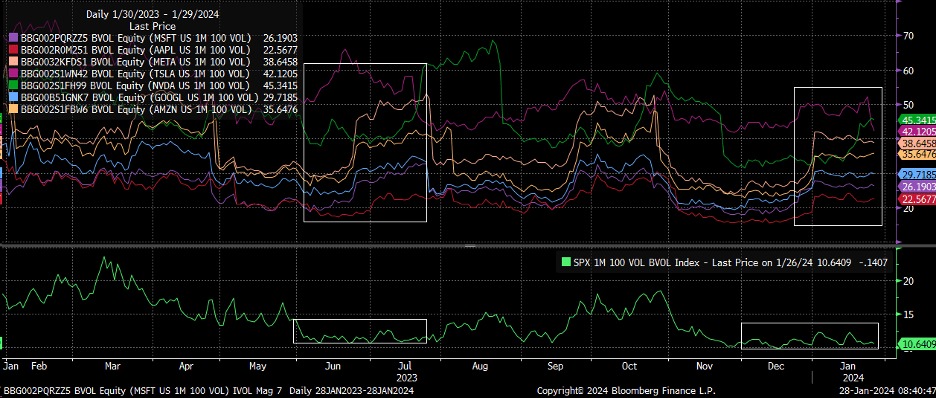
Well, suppose Janet does choose to sacrifice the present for the future. In that case, we enter a vulnerable period then because the volatility dispersion trade is likely to go through a rough patch right now, as implied volatility for the Mag 7 will see a big dip following the earnings releases (chart above) on Tuesday and Thursday. Once the event risk (earnings) passes, IV will fall sharply, and if IV in the Mag 7 falls, it defeats the purpose of the dispersion trade, causing it to unwind and pushing the implied correlation indexes (lower chart) higher as they did in July. The setup today looks similar to July’s from a vol dispersion perspective. (See: RTM: The Window For Volatility To Rise Is Now Open)
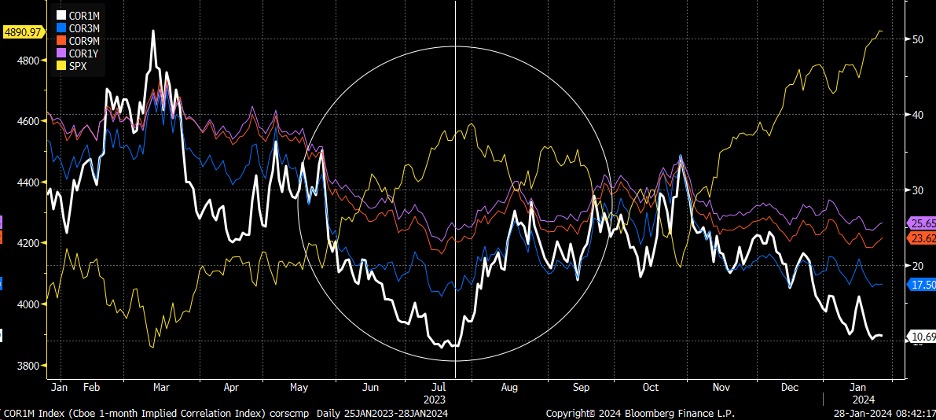
It is just a matter of the vol dispersion being large enough to kick the market back below the zero gamma level, which is currently at 4,820. If the S&P 500 gets back below 4,820 and we can flip back into negative gamma, then the odds of triggering systematic selling flows increase, which could start around the 20-day moving average.
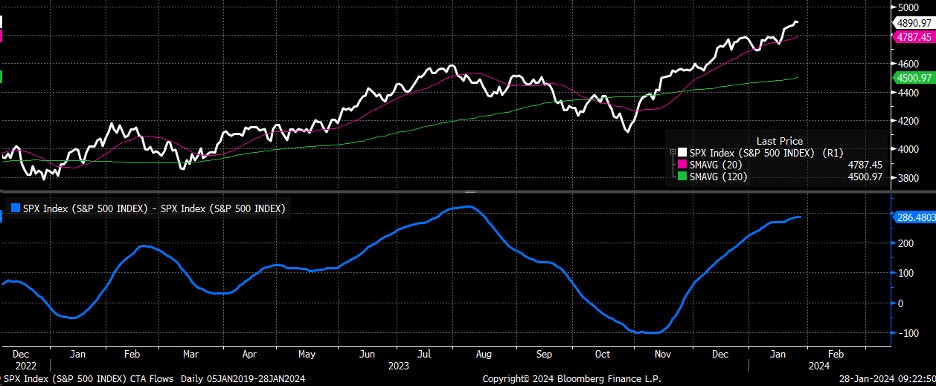
Unfortunately, this market is ruled by flows. It is all about the direction of those flows that matter in the short-term right now and where that starts and stops appear to be held with the direction of long-end of the Treasury curve, which leads to financial conditions tightening again, which can mean that then flows will turn unfavorable, starting the unwinding process. The direction of flows will start to be determined as early as tomorrow afternoon and sealed by Friday morning.
—
Originally Posted January 28, 2024 – THE FED WILL NOT BE THE MOST IMPORTANT HEADLINE THIS WEEK
Charts used with the permission of Bloomberg Finance L.P. This report contains independent commentary to be used for informational and educational purposes only. Michael Kramer is a member and investment adviser representative with Mott Capital Management. Mr. Kramer is not affiliated with this company and does not serve on the board of any related company that issued this stock. All opinions and analyses presented by Michael Kramer in this analysis or market report are solely Michael Kramer’s views. Readers should not treat any opinion, viewpoint, or prediction expressed by Michael Kramer as a specific solicitation or recommendation to buy or sell a particular security or follow a particular strategy. Michael Kramer’s analyses are based upon information and independent research that he considers reliable, but neither Michael Kramer nor Mott Capital Management guarantees its completeness or accuracy, and it should not be relied upon as such. Michael Kramer is not under any obligation to update or correct any information presented in his analyses. Mr. Kramer’s statements, guidance, and opinions are subject to change without notice. Past performance is not indicative of future results. Neither Michael Kramer nor Mott Capital Management guarantees any specific outcome or profit. You should be aware of the real risk of loss in following any strategy or investment commentary presented in this analysis. Strategies or investments discussed may fluctuate in price or value. Investments or strategies mentioned in this analysis may not be suitable for you. This material does not consider your particular investment objectives, financial situation, or needs and is not intended as a recommendation appropriate for you. You must make an independent decision regarding investments or strategies in this analysis. Upon request, the advisor will provide a list of all recommendations made during the past twelve months. Before acting on information in this analysis, you should consider whether it is suitable for your circumstances and strongly consider seeking advice from your own financial or investment adviser to determine the suitability of any investment.
Disclosure: Mott Capital Management
Mott Capital Management is the portfolio manager for one portfolio offered by Interactive Advisors. Interactive Advisors clients do not invest directly with the Portfolio Managers like Mott Capital Management, and the Managers do not have discretionary trading authority over Interactive Advisors client accounts. The Portfolio Managers on the Interactive Advisors platform simply license their trade data to Interactive Advisors, which then allows its clients to have the same strategy and trading decisions mirrored in their accounts if the Portfolio is in line with their risk score. Portfolio Managers like Mott Capital Management implement their trading philosophy and strategy without knowing the identity of Interactive Advisors’ clients or taking into account these clients’ individualized circumstances.
Mott Capital Management has entered into a Portfolio Manager License Agreement with Interactive Advisors pursuant to which it provides trading data IA uses to offer a portfolio to its investment advisory clients. Mott Capital Management is not affiliated with any entities in the Interactive Brokers Group.
Interactive Advisors is an affiliate of Interactive Brokers LLC.
Pursuant to the Investment Management Agreement between Interactive Advisors and its clients, all brokerage transactions occur through Interactive Brokers LLC, an affiliate of Interactive Advisors. The use of an affiliate for brokerage services represents a potential conflict of interest as Interactive Brokers LLC is paid a commission on trades executed on behalf of Interactive Advisors. Interactive Brokers LLC does not consider this conflict material as it does not sell, solicit, recommend, trade against or otherwise attempt to induce Interactive Advisors to place any orders in any products. Interactive Advisors does not offer services through any other broker-dealer. All trading by Interactive Advisors is self-directed. Interactive Advisors clients acknowledge this potential conflict of interest and authorize Interactive Advisors to execute transactions through Interactive Brokers LLC when they open an Interactive Advisors account. Clients should consider the commissions and other expenses, execution, clearance, and settlement capabilities of Interactive Brokers LLC as a factor in their decision to invest in an Interactive Advisors Portfolio. Interactive Advisors believes it satisfies its best execution obligation by trading its clients’ trades through Interactive Brokers LLC. While there can be no assurance that it will in fact achieve best execution, Interactive Advisors does periodically monitor the execution quality of transactions to ensure that clients receive the best overall trade execution pursuant to regulatory requirements.
Disclosure: Interactive Brokers
Information posted on IBKR Campus that is provided by third-parties does NOT constitute a recommendation that you should contract for the services of that third party. Third-party participants who contribute to IBKR Campus are independent of Interactive Brokers and Interactive Brokers does not make any representations or warranties concerning the services offered, their past or future performance, or the accuracy of the information provided by the third party. Past performance is no guarantee of future results.
This material is from Mott Capital Management and is being posted with its permission. The views expressed in this material are solely those of the author and/or Mott Capital Management and Interactive Brokers is not endorsing or recommending any investment or trading discussed in the material. This material is not and should not be construed as an offer to buy or sell any security. It should not be construed as research or investment advice or a recommendation to buy, sell or hold any security or commodity. This material does not and is not intended to take into account the particular financial conditions, investment objectives or requirements of individual customers. Before acting on this material, you should consider whether it is suitable for your particular circumstances and, as necessary, seek professional advice.
