Sector and industry work is a key part of the Mill Street institutional product suite, and the topic of which sectors are in or out of favor comes up frequently in my media appearances. So this post is an example of some of the sector/industry work I do, and updates a much earlier post on this topic.
Diving into Tech
Technology stocks have outperformed dramatically over the last 12 months, but have shown more mixed relative returns in the last three months. This is true not just for the widely-watched mega-caps but for the broader sector as well: when we calculate returns to our broad universe of 300 Technology stocks on an equal-weighted basis (rather than cap-weighted), we see the same return pattern.
However, one of the key points I often make to Mill Street’s institutional clients is that the 11 broad sector classifications (whether by GICS, which we use, or others) are often too broad and heterogeneous, and drilling down into the more granular industries can give a much clearer picture of where the real strength and weakness is.
This is vividly true within the Technology sector now, and has often been the case in the past. Indeed, I wrote about the divisions within the Tech sector’s fundamentals nearly three years ago here in this blog, which at that time favored the “hardware” side of the sector over the “software” side. But over the last 18 months or so, and to a greater degree now, it is the “software” side of the Tech sector that is clearly the leader while hardware-related industries are weaker.
Defining terms
What do I mean by the “software” and “hardware” side of the Tech sector? First, to be clear, at Mill Street we base sector and industry classifications on the widely-used GICS (Global Industry Classification System) framework maintained by S&P and MSCI (and thus used in their benchmark indices). So some stocks that are often included in the “tech” category by investors are not in fact classified as being in the Technology sector by GICS. Key examples include Alphabet (Google), Meta Platforms, Amazon.com, and Tesla. The first two are in Communication Services, while the other two are in Consumer Discretionary.
Within the 11 broad (top-level) sectors in the GICS system, there are 25 industry groups, and 76 industries (and 163 sub-industries). The table below shows the six industries within the Technology sector along with their returns over the last 1/3/6/12 month periods. The returns are based on equally-weighting the stocks in each industry, so the mega-cap stocks do not dominate the results as they do in typical cap-weighted returns.
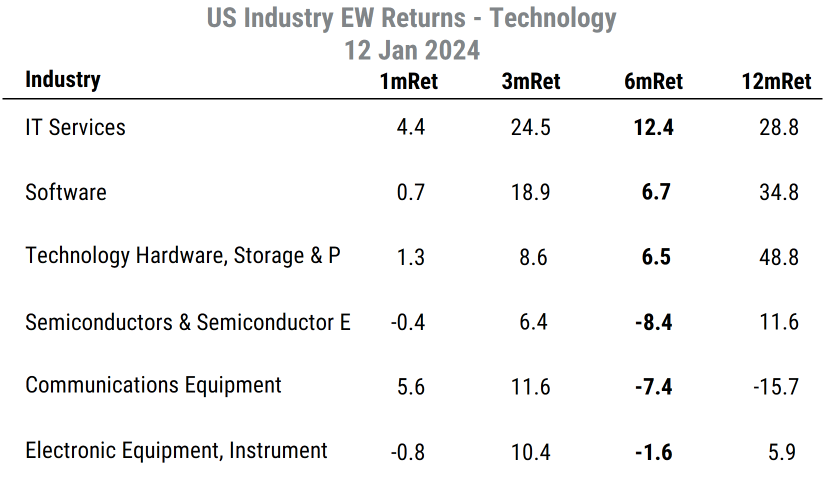
Source: Mill Street Research
For the purpose of this analysis, I am considering the Software industry and IT Services industry together to be the “Software” side of the Tech sector (aligning with the “Software and Services” industry group in the GICS structure). Because there are so many Software companies, those two industries combined make up just over half of the total companies in the sector within our universe. The remaining four industries are all related to making technology-oriented hardware, so they are combined in to the “Hardware” grouping here.
Software has been outperforming Hardware
The first point is that over the last three months, the Software and IT Services industries have substantially outperformed the others, and outperformed the broader US stock market’s return of about 14%. They have also outperformed over the last six months, and over the last 12 months with the exception of the Technology Hardware, Storage and Peripherals industry. So the “Software” side of the sector has been outperforming the “Hardware” side for some time now.
Is this just “animal spirits” driving the return differences, or is there a fundamental reason? Our data shows that there is a fundamental driver for Software’s leadership.
The table below shows our measure of earnings estimate revisions breadth for each of the six Tech industries and the overall sector. Revisions breadth is the average net proportion of analysts raising their forward 12-month earnings estimates net of those lowering estimates. So the figure can range from +100% (all analysts raising estimates) to -100% (all analysts cutting estimates), with 0% indicating an even split. In the table we show the average breadth figures calculated two ways: with each stock equally-weighted (“EW”) and a capitalization-weighted (“CW”) figure that gives more weight to the largest stocks, as is typical in benchmark indices.
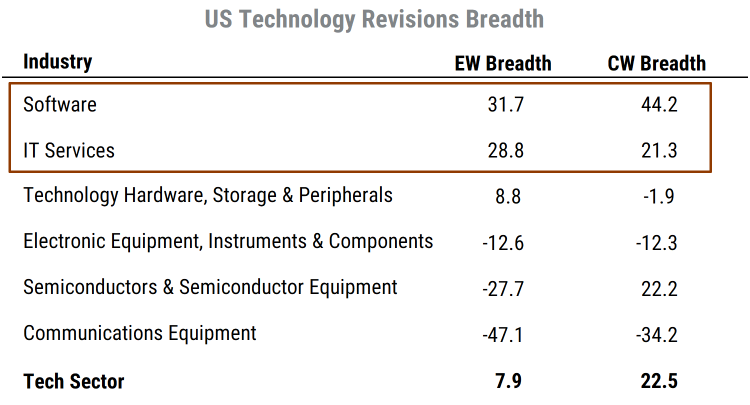
Source: Mill Street Research, Factset
The key point is that the revisions breadth for the two “Software” industries is much higher than for the others (the “Hardware” industries) overall. Indeed, three of the four “Hardware” industries have outright negative average revisions breadth on an equal-weighted basis, meaning the average stock in those industries is seeing more analysts cut estimates than raise them. For comparison, right now the average US stock has revisions breadth of -6%.
The cap-weighted readings show a similar overall pattern, but are skewed in some cases by one or two mega-cap constituents. In Semiconductors, for example, strong revisions for NVIDIA (NVDA) alone are enough to push the cap-weighted reading up, as its $1.3 trillion market cap makes up nearly 40% of the industry’s total market value.
A look at recent history
Is this a new fundamental trend or has it been going on for a while? And does it have a relationship with relative returns within the sector?
The chart below shows the relative returns and relative revisions for the “Software” grouping versus the “Hardware” grouping, with rising or positive readings indicating Software outperforming Hardware and vice versa. The shaded areas indicate periods when Software revisions were stronger than Hardware, and thus when we might expect relative returns to favor Software over Hardware.
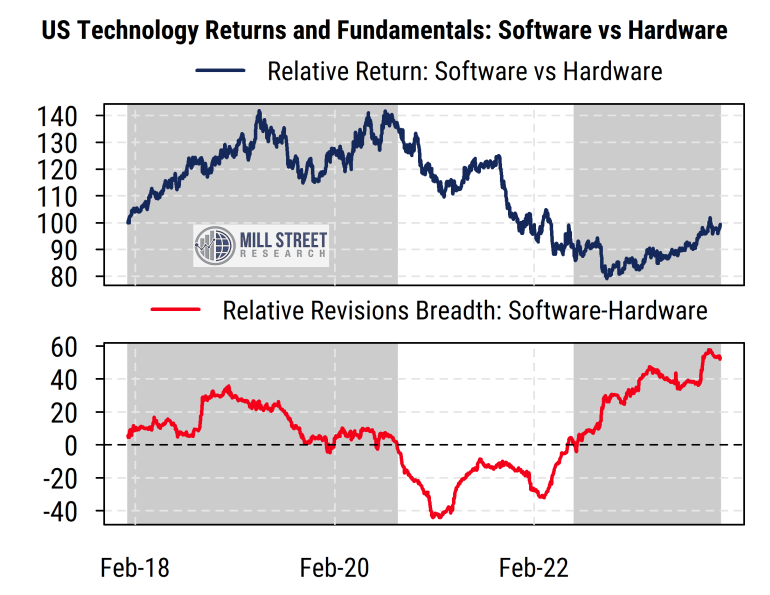
Source: Mill Street Research, Factset
In recent years, the relative fundamental trends (revisions) have indeed aligned with, and often led, the relative returns. And right now, we see that the revisions breadth gap between Software and Hardware industries (red line) is extremely wide in favor of Software. That spread turned positive (favoring Software) in late July 2022 and has mostly been getting increasingly positive since then. The relative return (blue line) started turning up in late 2022, and has moved more decisively in favor of Software industries since July 2023. Of course, other factors will influence relative returns, most notably valuations, which tend to be higher for Software companies than for Hardware companies.
Top-down vs bottom-up
Is there a macro driver for the “bottom-up” fundamental trends?
Another thing I often look for is alignment between our “bottom-up” (company-level aggregated) indicators and “top-down” or macroeconomic or cross-market indicators. One that I have noted before is the relative pace of corporate investment in software relative to investment in hardware. As part of the National Income and Product Accounts (NIPA), which includes all the GDP data, the Bureau of Economic Analysis estimates spending on computer hardware and on software (among many other things).
The chart below plots the year-on-year growth rates of each category of investment in the top section, while the bottom section plots the ratio of the level of spending on software versus hardware. A rising grey line indicates that investment in software is growing faster than investment in hardware (and vice versa). As we can see, the line has mostly been rising over the last 30 years, indicating a persistently higher growth rate of spending on software than hardware.
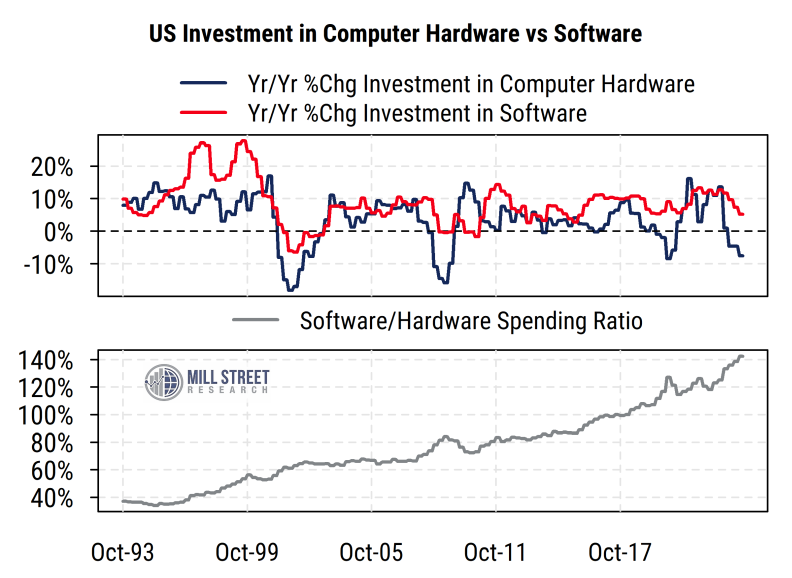
Source: Mill Street Research, Bureau of Economic Analysis
The growth rates in the top section show that hardware spending has recently fallen off much more than software spending. After a surge in hardware spending during and after COVID, it has dropped back to negative year-on-year growth. Software spending, meanwhile, has slowed from earlier high levels but remains positive (and has rarely been negative). So software spending is still outperforming hardware spending at a macro level.
This macro data thus corroborates the general trends we see in the aggregated company-level earnings estimate activity. Unlike the situation three years ago when hardware spending and earnings estimate revisions activity was stronger than that of software, now software-related spending is well ahead of hardware spending overall. Certainly, some companies within each category will diverge (very strong hardware makers or weak software/services providers), but the trend within the Technology sector continues to favor software and services providers over hardware providers in our work.
—
Originally Posted January 15, 2024 – SOFT SIDE OF TECH IS STILL THE PLACE TO BE
Disclosure: Mill Street Research
Source for data and statistics: Mill Street Research, FactSet, Bloomberg
This report is not intended to provide investment advice. This report does not constitute an offer or solicitation to buy or sell any securities discussed herein in any jurisdiction where such offer or solicitation would be prohibited. Past performance is not a guarantee of future results, and no representation or warranty, express or implied, is made regarding future performance of any security mentioned in this report.
All information, opinions and statistical data contained in this report were obtained or derived from public sources believed to be reliable, but Mill Street does not represent that any such information, opinion or statistical data is accurate or complete. All estimates, opinions and recommendations expressed herein constitute judgments as of the date of this report and are subject to change without notice.
Disclosure: Interactive Brokers
Information posted on IBKR Campus that is provided by third-parties does NOT constitute a recommendation that you should contract for the services of that third party. Third-party participants who contribute to IBKR Campus are independent of Interactive Brokers and Interactive Brokers does not make any representations or warranties concerning the services offered, their past or future performance, or the accuracy of the information provided by the third party. Past performance is no guarantee of future results.
This material is from Mill Street Research and is being posted with its permission. The views expressed in this material are solely those of the author and/or Mill Street Research and Interactive Brokers is not endorsing or recommending any investment or trading discussed in the material. This material is not and should not be construed as an offer to buy or sell any security. It should not be construed as research or investment advice or a recommendation to buy, sell or hold any security or commodity. This material does not and is not intended to take into account the particular financial conditions, investment objectives or requirements of individual customers. Before acting on this material, you should consider whether it is suitable for your particular circumstances and, as necessary, seek professional advice.
