1/ A Broken String of All-Time Highs
2/ Apple’s Unusual Divergence
3/ Trouble in Houses
Investopedia is partnering with CMT Association on this newsletter. The contents of this newsletter are for informational and educational purposes only, however, and do not constitute investing advice. The guest authors, which may sell research to investors, and may trade or hold positions in securities mentioned herein do not represent the views of CMT Association or Investopedia. Please consult a financial advisor for investment recommendations and services.
1/A Broken String of All-Time Highs
In January of this year, the S&P 500 broke through its 2021 high water mark and posted a new all-time high. Through February and March it made a regular practice of posting new all-time highs each week, though the price action has taken a pause over the past few days. (See chart of S&P 500 ETF, SPY, below).

Most notable in the past two weeks’ price action was the fierce rejection of a buying surge that occurred last Thursday, April 4th. Price hit a deep low for the day only slightly slower than a basketball rejected by Zach Edey in the NCAA championship game last night.
Since then, the response of buyers has been tepid at best, and it remains to be seen if prices can launch for new highs as earnings begin to roll out later this week with Delta (DAL) on Wednesday followed by J.P.Morgan Chase (JPM) and Wells Fargo (WFC) on Friday. Earnings will have to be surprisingly strong to help buyers get past the fact that the Fed may not cut interest rates as much as they want this year. For now it looks like the madness of crowds seen in March is truly over.
2/ Apple’s Unusual Divergence
If you had a group of investors in a room trying to persuade each other that stocks were likely to continue bullish for the next few months, they’d likely have to lean right or left to see each other. They’d have to look around the elephant in the room, a.k.a. Apple (AAPL).
This stock represents about 7% of the market cap of the Nasdaq 100, thus it is highly influential on the index. So it is a bit of a marvel that Invesco’s Nasdaq ETF (QQQ), is able to continue its march higher despite shares of the tech giant taking a divergent path lower.
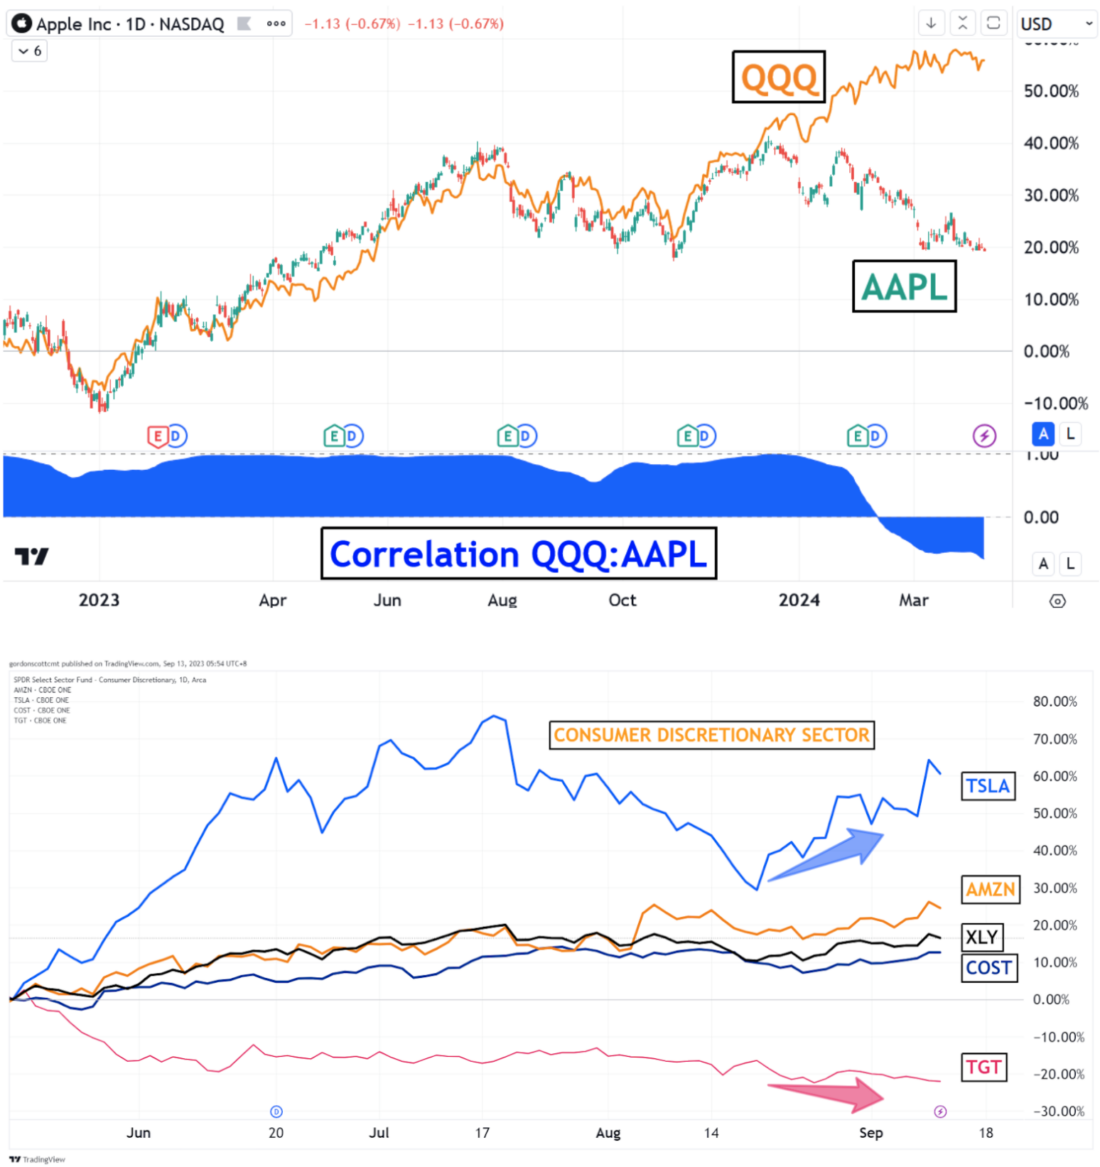
In the past 20 years, such a divergence has only happened twice. In both cases, after a period of about six months, AAPL shares were positioned at what one could only consider (in hindsight anyway) as the buy of the decade. Until Apple gets a serious stake in the AI future, or some similar major technological advance, it will be difficult to imagine a replay of that pattern, but it could happen.
Meanwhile the shares are weighing heavily on the tech index and may make it difficult for investors to see all-time highs during the second quarter of this year.
3/ Trouble in Houses
The following chart shows the share price action of Home Depot (HD) during the past three months, overlaid on a technical indicator called an Anchored VWAP, with bands showing multiples of an Average True Range (ATR) designating a price level of +1, +2, -1 and -2 ATRs above the multi-day VWAP line.
The purpose of this indicator (courtesy of VantagePoint Software) is to reflect institutional buyer’s preferences for the stock by simply showing support or resistance at the various lines shown.
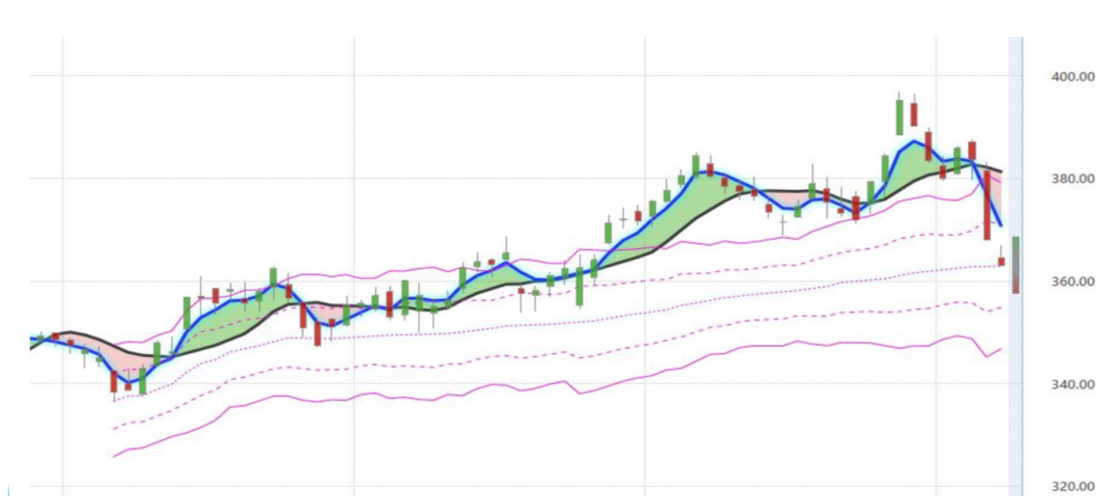
This picture gives a pretty clear indication that while this stock has been in high demand among institutional buyers as of late, the tide may have turned over the past two weeks. This is an interesting indication because the homebuilding sector has been strong up until now, and this chart might be the earliest evidence that this is changing.
This picture gives a pretty clear indication that while this stock has been in high demand among institutional buyers as of late, the tide may have turned over the past two weeks. This is an interesting indication because the homebuilding sector has been strong up until now, and this chart might be the earliest evidence that this is changing.
——
Originally posted on April 9th, 2024
Disclosure: Investopedia
Investopedia.com: The comments, opinions and analyses expressed herein are for informational purposes only and should not be considered individual investment advice or recommendations to invest in any security or to adopt any investment strategy. While we believe the information provided herein is reliable, we do not warrant its accuracy or completeness. The views and strategies described on our content may not be suitable for all investors. Because market and economic conditions are subject to rapid change, all comments, opinions and analyses contained within our content are rendered as of the date of the posting and may change without notice. The material is not intended as a complete analysis of every material fact regarding any country, region, market, industry, investment or strategy. This information is intended for US residents only.
Disclosure: Interactive Brokers
Information posted on IBKR Campus that is provided by third-parties does NOT constitute a recommendation that you should contract for the services of that third party. Third-party participants who contribute to IBKR Campus are independent of Interactive Brokers and Interactive Brokers does not make any representations or warranties concerning the services offered, their past or future performance, or the accuracy of the information provided by the third party. Past performance is no guarantee of future results.
This material is from Investopedia and is being posted with its permission. The views expressed in this material are solely those of the author and/or Investopedia and Interactive Brokers is not endorsing or recommending any investment or trading discussed in the material. This material is not and should not be construed as an offer to buy or sell any security. It should not be construed as research or investment advice or a recommendation to buy, sell or hold any security or commodity. This material does not and is not intended to take into account the particular financial conditions, investment objectives or requirements of individual customers. Before acting on this material, you should consider whether it is suitable for your particular circumstances and, as necessary, seek professional advice.
