A big gap between S&P earnings and price … the Toxic Trifecta are back on the move north … everything is recalibrating except stocks … catch the replay of last night’s AI event with Luke Lango
Over the long term, stock prices reflect the strength/weakness of underlying earnings.
This makes sense. After all, when you buy a stock, you’re becoming a part owner in a company. Earnings make or break your return.
However, in the shorter term, sentiment often rules the day.
Bullish euphoria can push a stock price far higher than it deserves to trade based on earnings, while bearish despair can drag it to underserved depths.
The gap between the S&P’s price (based on bullish euphoria) and its projected earnings is a growing concern, and it suggests something has to give
Below, we look at a 10-year chart showing the price of the S&P 500 in light blue and the forward 12-month estimate of earnings per share in dark blue.
Before we add any additional commentary, what do you notice?
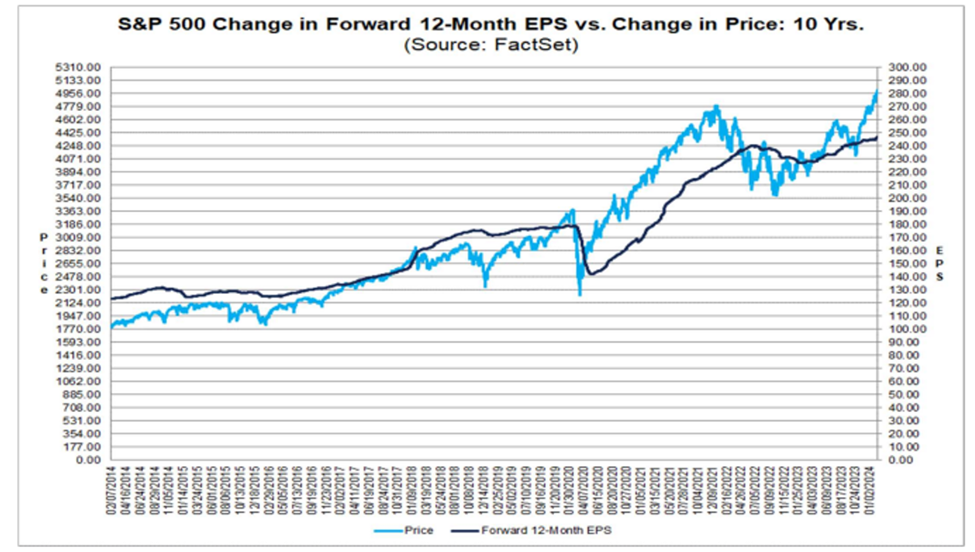
What strikes me is that this is the second widest divergence between the S&P’s price and expected 12-month earnings over the last 10 years.
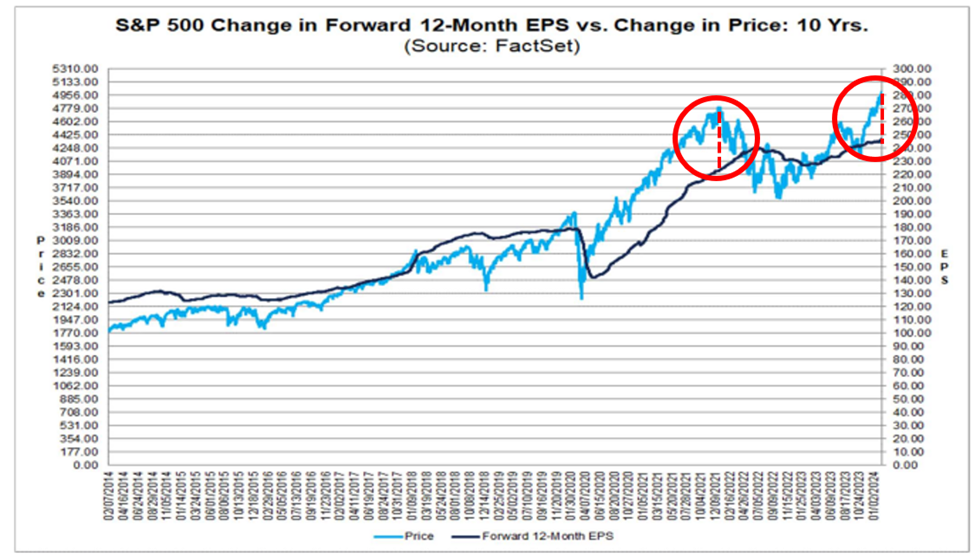
What happened last time we saw this level of divergence where the S&P’s price towered over expected earnings? Did earnings explode higher to support the elevated state of the S&P?
Nope. The price of the S&P crashed in the 2022 bear market.
And although I used the term “crash,” the more appropriate description would be “normalized to better reflect the true state of earnings.”
So, what’s going to happen this time around?
Will earnings explode higher over the next 12 months to support today’s cavernous divergence? Or will the S&P begrudgingly fall to better reflect real earnings?
As we answer this, let’s revisit a series of headwinds that weighed on the market last summer/early fall – “The Toxic Trifecta”
From late-July through late-October, stocks took it on the chin. The S&P fell 8% while the Nasdaq shed 12%.
The poor performance was largely attributable to three influences, the Toxic Trifecta as we called them: the climbing 10-year treasury yield, the strengthening U.S. dollar, and rising oil prices.
But then came November…
Cooler inflation readings eased treasury yields… the economic slowdown in China, as well as record U.S. oil production, took pressure off oil prices… and the market’s expectation of a rate-cut bonanza in 2024 helped ease the dollar.
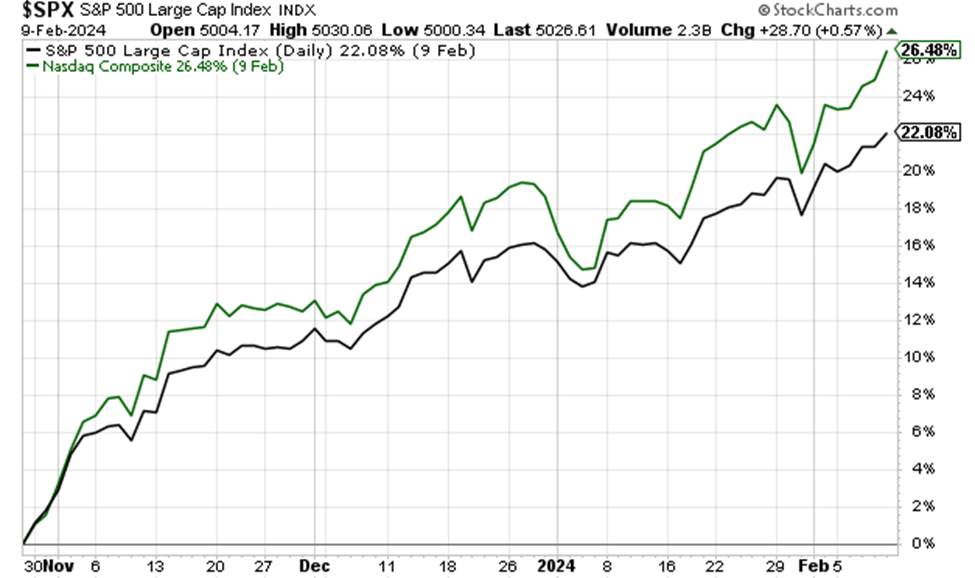
This resulted in a 22% surge from the S&P and a 26% pop from the Nasdaq between late-October and the end of last week.
But while the Toxic Trifecta went into hibernation early in this period, it’s been a different story since late-December.
In short, the Toxic Trifecta are stirring from slumber.
The Toxic Trifecta – back from the dead
For any newer Digest readers, let’s make sure we’re all on the same page about the Trifecta and why they’re bad for stocks.
The higher the 10-year treasury yield climbs, the more pressure it puts on the market. This happens because a higher yield means a higher discount rate, which lowers stocks’ current valuations. It’s also because a higher 10-year treasury yield entices some investors to pull their money out of stocks to benefit from this “risk free” higher yield which puts downward pressure on stock prices.
Meanwhile, stock prices also don’t like a strengthening U.S. dollar. As we’ve detailed in prior Digests, a stronger dollar creates currency headwinds for international companies that generate significant revenues overseas.
Finally, higher oil prices are self-explanatory. They hurt the disposable income of shoppers as well as the input costs of a huge spectrum of companies.
So, what’s happened to the Toxic Trifecta since late-December?
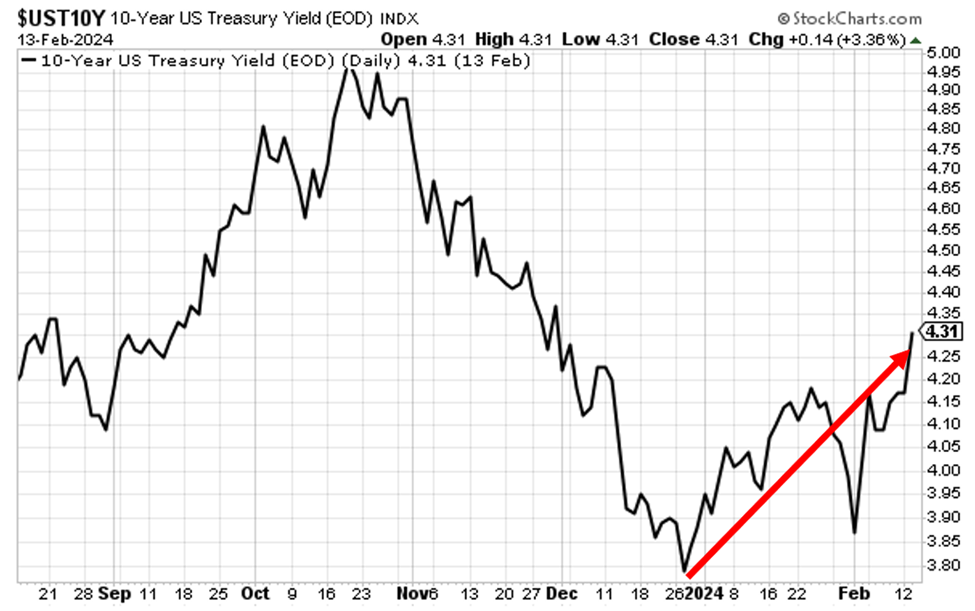
First, the 10-year Treasury yield.
It’s jumped from about 3.78% to about 4.30% as I write Wednesday morning…
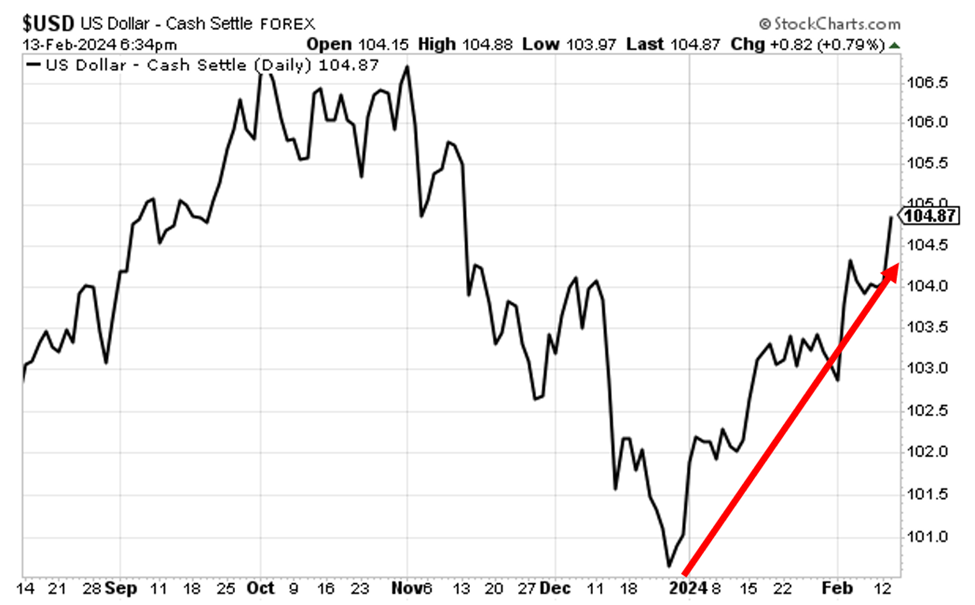
Next, the dollar.
It’s climbed from roughly 100 to nearly 105…
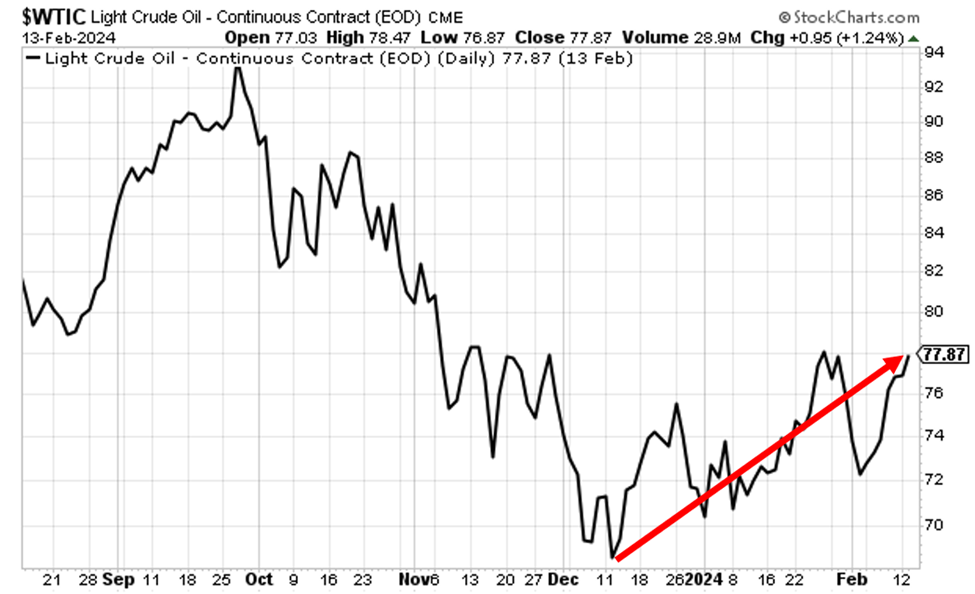
And finally, oil.
While it hasn’t added as much loft as the 10-year yield or the dollar, it’s climbed from the upper-$60s to the upper-$70s as I write.
Now, you would think the strengthening Toxic Trifecta would weigh on stock prices
Not so much.
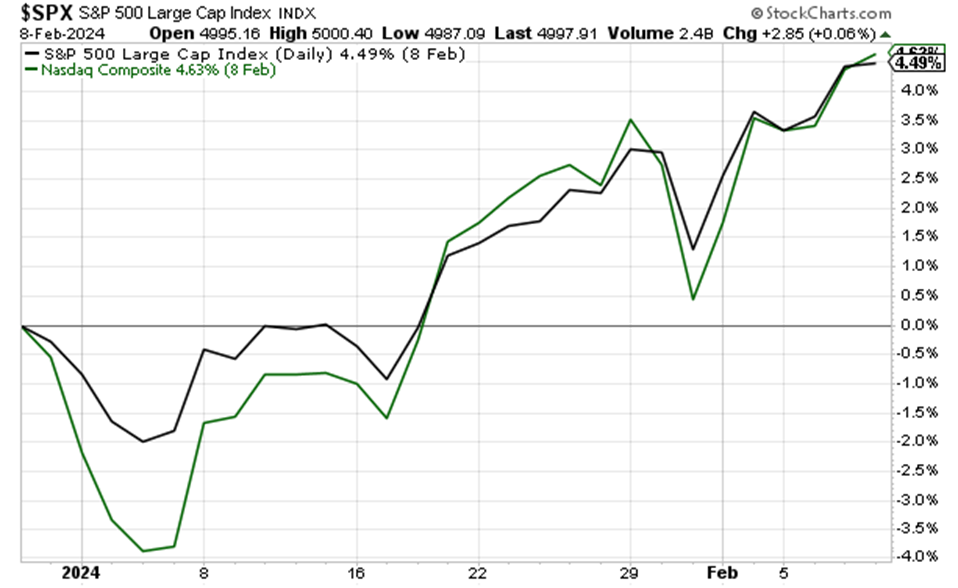
As you can see below, though the S&P and the Nasdaq swooned briefly between Christmas and early-January, bulls didn’t concede any gains through last week’s all-time high in the S&P.
Why? How is that Wall Street has continued to climb despite these headwinds?
In short, Wall Street has been fixated on its belief that 2024 would bring an avalanche of fast-and-furious rate cuts (despite cautionary words to the contrary from Federal Reserve members).
So, it has flat-out ignored the stirring Toxic Trifecta, instead believing that the Fed’s “higher for longer” messaging was just bluster, and the bullish influence of lower rates would outweigh all negative factors.
That’s why yesterday’s Consumer Price Index (CPI) reading was so damaging.
The reality about yesterday’s CPI data
It wasn’t bad. The numbers show that inflation continues to fall.
So, why did the market blow up?
Because the data came in slightly hotter than expected which dashed hopes of loads of rate cuts beginning this spring.
This is the quick sum-up from CNBC:
Stocks dropped on Tuesday after hotter-than-expected inflation data for January spiked Treasury yields and raised doubts that the Federal Reserve would be able to cut rates several times this year, a key part of the bull case for the equity market.
In mid-December, following the Fed’s updated Dot Plot, Wall Street priced in six different quarter-point cuts in 2024. That was double the amount of cuts the Dot Plot showed.
Since then, Fed members have (mostly) talked tough about being slow to cut rates, resulting in futures traders begrudgingly lowering their forecasts.
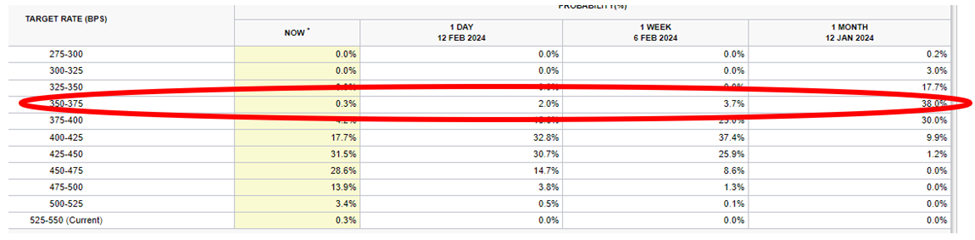
To illustrate, in the wake of yesterday’s CPI print, the December 2024 fed funds target range with the heaviest odds came in at 4.25% – 4.50%. This represents four different quarter-point cuts, which is reasonable based on the Fed’ December 2023 Dot Plot showing three cuts.
But it’s taken a while for futures traders to get here.
Just one month ago, the going expectation was that December 2024’s target range would be 3.50% – 3.75%, a whopping seven quarter-point cuts beneath today’s target range.
While futures traders have finally tamped down their expectations, have we seen Wall Street traders reprice stocks lower in similar fashion?
Hardly.
Last Friday, the S&P set its all-time-high of 5,026.61. And as I write Wednesday, stocks are doing their best to brush off yesterday’s pullback.
So, let’s recap:
- The Toxic Trifecta are again setting a headwind for stock prices…
- The Fed continues to talk tough about being slow to cut rates, as well as the potential scope of those rate cuts…
- Futures traders have priced in far fewer rate cuts by December than they did one month ago…
- We have a substantial divergence between the S&P’s price and its expected 12-month S&P earnings…
And yet, until yesterday, stock prices haven’t conceded an inch (and it looks like they want that inch back here on Wednesday).
It makes me nervous when everything is recalibrating except stock prices.
But let’s not go “full bear”
In recent Digests, we’ve covered how the overvaluation of the Magnificent Seven stocks is skewing how the broad S&P looks today.
We’ve also been quick to point out the dangers of drawing broad conclusions about stocks based on “the market.” After all, your specific portfolio might bear little resemblance to the S&P 500.
That said, being cautious and looking squarely at the risks to your money is always a wise move.
So, I encourage you to take a few minutes this afternoon…
How does your portfolio look? To what extent do you own stocks with excessive valuations? To what extent do you own stocks that require the Fed to slash rates to perform well?
In general, how robust is your portfolio, and can you stomach a meaningful drop?
Let’s also be balanced in our analysis and examine the bull case…
What quality stocks do you want to buy if we finally see the market provide a substantive correction?
Regular Digest readers know that we’re extremely bullish on top-tier AI stocks beyond just the Mag 7 plays. If we’re about to see some softness in the broad market, it’s likely to offer some fantastic buying opportunities in quality small- and mid-cap AI stocks. Do you know which ones you want to add to your portfolio?
Last night, our hypergrowth expert Luke Lango held his “AI Endgame ” event that detailed the top small-and mid-cap AI stocks he’s bullish about today. You can watch a free replay right here. If you’re looking for AI ideas, you don’t want to miss Luke’s presentation.
Wrapping up, the Toxic Trifecta are back, and they’re a growing headwind for the S&P. So, for the quality stocks you already own, be ready for some volatility… for the lesser quality stocks you already own, mind your stop losses… and for the quality stocks you want to buy, get your watch list ready.
Have a good evening,
Jeff Remsburg
