Markets are getting slammed today after this morning’s release of a hotter-than-expected Consumer Price Index (CPI). The report is a bitter pill for a disinflation narrative that is losing steam against the backdrop of the third-consecutive month of accelerating price pressures. January’s price jump, furthermore, can’t be blamed on gasoline, with services responsible for driving the CPI higher. Yields are soaring and equities are losing momentum as market players sharply reevaluate the path for rate cuts. Indeed, a market that once expected seven cuts starting in March is now penciling in three or four beginning in June.
A Tough Start for the Year
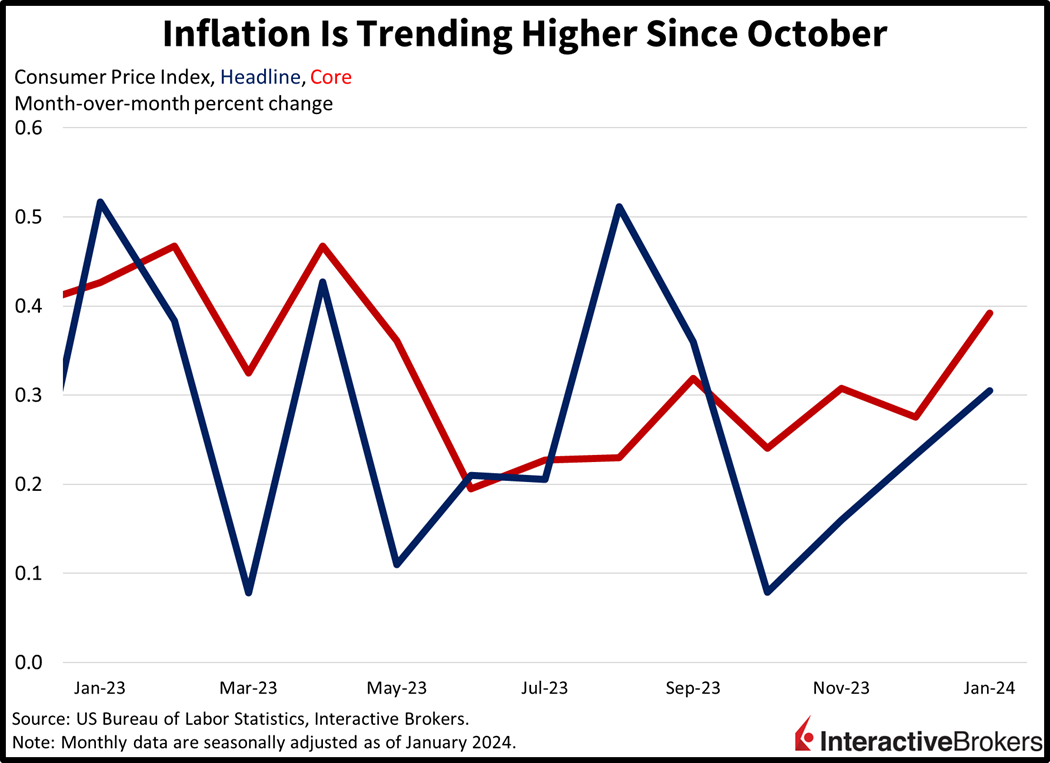
January’s CPI accelerated with overall prices rising 0.3% month over month (m/m). Core prices, which exclude food and energy due to their volatile characteristics, rose 0.4% m/m. Year-over-year (y/y) figures came in at 3.1% for headline and 3.9% for core. Today’s results flew past projections for 0.2% and 0.3% m/m, which would’ve been unchanged from December, and 2.9% and 3.7% y/y. Price pressures were led by energy services (heating and electric), which gained 1.4%. Other leaders and their respective price increases included the following:
- Transportation services, 1%
- Medical care, 0.7%
- Shelter, 0.6%
- Food at dining establishments, 0.5%
- Food at markets, 0.4%
Deflation in certain categories helped offset some of the pain, with used automobiles prices declining 3.4%. Other categories and their price declines included the following:
- Gasoline, 3.3%
- Apparel, 0.7%
- Medical care commodities, 0.6%
New automobile prices were unchanged.
Looser Financial Conditions Drive Price Gains
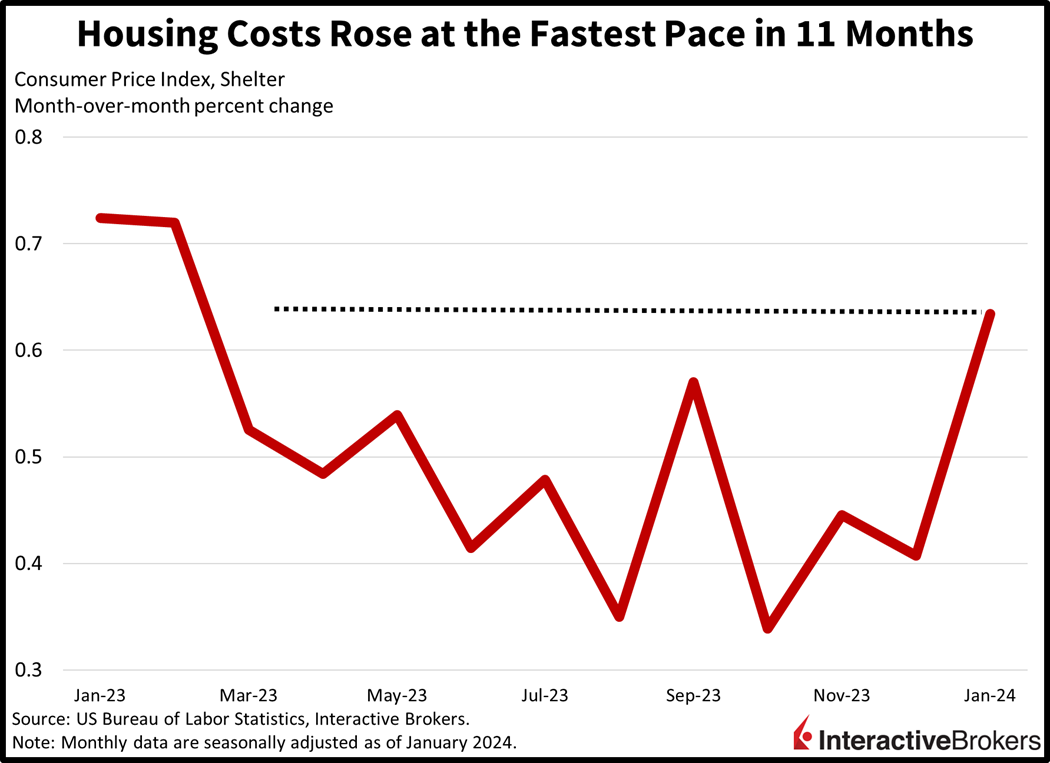
One of the problems with the recent loosening of financial conditions and much higher stock prices is that they both directly contribute to stronger housing activity. Shelter accelerated at the fastest clip in 11 months, as improving developments in the sector boosted prices, transactions and rents. Housing costs are a huge component of American budgets, comprising roughly a third of the CPI. Animal spirits in markets that are generating fierce rallies are an impediment to the Fed’s inflation battle to the extent that they propel demand and prices. Shelter inflation will remain a risk. Sure, new rents are declining but most rents are renewals. Who do you know that received a rent discount upon a lease renewal? Costs are going up significantly for landlords via insurance, maintenance, labor, interest, etc. and property owners are passing those costs to renters.
Energy to Push Inflation Higher
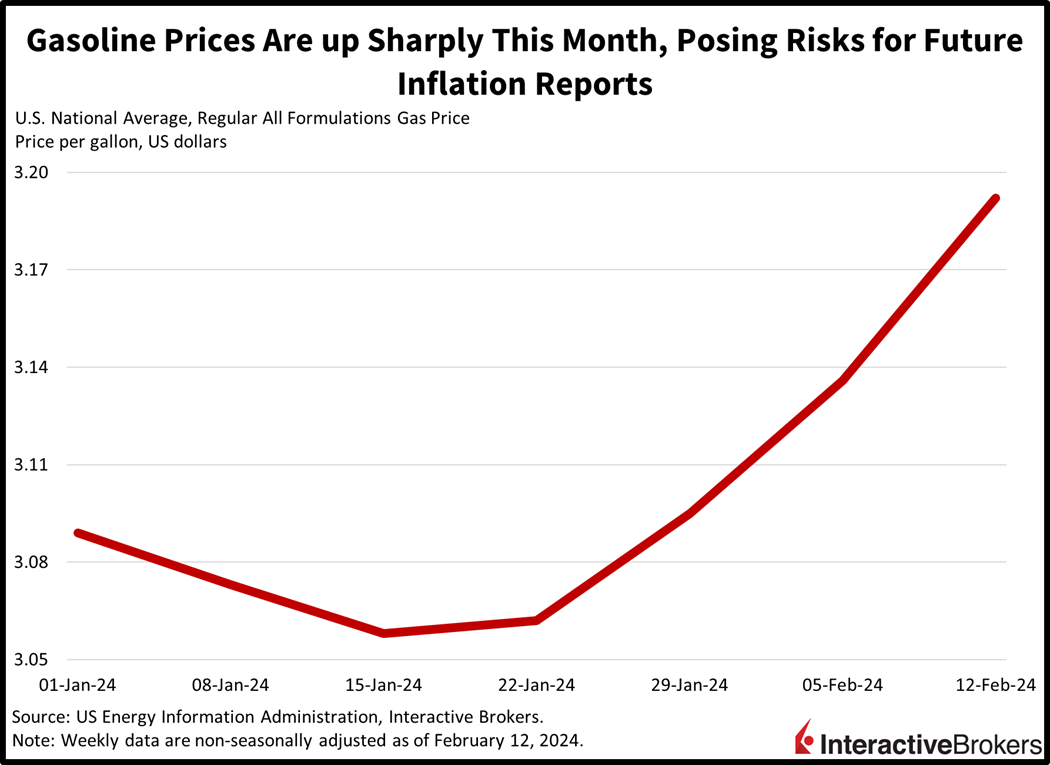
Looking forward to the next CPI report, gasoline is expected to transition from headwind to tailwind in this month’s figure that will be released in March. Indeed, our real-time measures of gasoline prices are currently tracking 2.9% higher than January on a m/m basis. The development is likely to serve as a headwind to markets with the last mile of inflation requiring labor-intensive services to move the needle after goods and commodities did most of the disinflationary work last year. The issue with services inflation is that bringing it down will likely require reduced labor headcounts across the economy. Such a development could serve as a severe detriment to the economy amidst fed funds above 5.25% and the 10-year above 4.25%.
Earnings Reports Offer Mixed Outlooks
Recent earnings reports depict both strong growth in online retail sales and entertainment demand but weakening wanderlust among consumers. Those trends were illustrated by the following quarterly results:
- Marriott International posted disappointing revenue but its EPS of $3.57 beat the analyst expectation of $2.12 and increased from $1.96 y/y. The EPS was supported by a one-time tax benefit. However, revenue of $6.09 billion missed the analyst expectation of $6.20 billion. CEO Anthony Capuano said the company expects the surge in post-pandemic travel demand to continue moderating with the exception of China, which has yet to experience a strong increase due to its weak economy. China will eventually account for revenue growth as travel in other countries returns to more normal levels. The company’s share price dropped approximately 3% after Marriott said it anticipates full-year 2024 profit ranging from $9.18 to $9.52 per share. Analysts expected guidance of $9.69 per share.
- Shopify benefited from strong consumer spending and it exceeded expectations for both revenue and earnings. The company’s earnings per share (EPS) of $0.34 climbed from $0.07 in the year-ago quarter and beat the analyst expectation by $0.03. Revenue of $2.14 billion increased 24% y/y and soared past the expectation of $2.08 billion. Shopify provides internet infrastructure for ecommerce and a portion of its revenue is based on the dollar value of merchandise sold by its clients. The volume increased 23% to $75.1 billion and surpassed estimates of $71.53 billion. Revenue for other services, or merchant solutions, climbed 21% to $1.6 billion compared to estimates of $1.57 billion. Shopify said it expects 2024 growth in the mid-to-high twenties percentage range after accounting for the sale of its logistics business. Analysts expected guidance calling for a 19% increase. Shares are down 11% on expectations that higher costs will weigh on the bottom line.
- Coca-Cola’s results benefited, in part, from an ongoing post-pandemic uptick in consumers splurging on entertainment, such as sporting events and movies. The company has passed higher input costs on to customers by raising prices, a change that has been accepted by consumers as they splurge on entertainment. The company’s unit volume increased 2% while its selling prices, on average, increased 9%. For the recent quarter, its $0.49 EPS after adjusting for one-time expenses climbed 10% y/y and exceeded the expectation of $0.48. Revenue of $10.85 billion was also strong, growing 7% and exceeding the expectation of $10.66 billion. Perhaps more significantly, organic revenue, or revenue resulting from business segments in place for at least a year, increased 12%. Shares are down 1.5% on the news.
Regional Banks Get Hammered on Reduced Rate Cut Outlook
The updated path of monetary policy based on fed funds futures pricing is battering stocks and bonds alike. Stocks are selling off hard led by rate sensitive small-caps while yields soar across the curve with the short-end climbing the most. For equities, the small-cap, rate-sensitive Russell 2000 is the biggest laggard; it’s down 3%. Its weakness is being driven by the regional bank and real estate sectors, which are down 4% and 3%, respectively. Indeed, hotter inflation and rising yields complicate the picture for both segments. Regional banks not only have to contend with their long-duration securities losing more value as they run up against the expiration of the Bank Term Funding Program on March 11, they must also deal with a plethora of commercial real estate refinancings whose structures are weakening against the backdrop of loftier costs of capital. Finally, to hold deposits, regionals won’t be able to slash their interest expenses to depositors until the Fed cuts rates, which may not occur until June. Many regionals will likely fail by then, as the burden of long-duration securities, commercial real estate refinancings and elevated cost of funds weigh on capital levels and liquidity conditions.
As for the other stock indices, the Dow Jones Industrial, Nasdaq Composite and S&P 500 benchmarks are all down 1.1%. Sectoral breadth is awful with every segment lower on the session. Utilities, real estate and consumer discretionary are the biggest laggards with declines of 3%, 3% and 1.6%. In fixed-income land, yields are shifting in bear-flattening style, with the 2- and 10-year Treasurys trading at 4.61% and 4.28%, 13 and 10 basis points (bps) higher on the session. Soaring yields and elevated price pressure projections are lifting the dollar, with the greenback’s index up 66 bps to 104.82. The US currency is gaining against all major currency peers including the euro, pound sterling, franc, yen, yuan and Aussie and Canadian dollars. Despite a stronger dollar and weaker Fed easing expectations, crude oil is up sharply due to continued tensions in the Middle East. WTI crude is up 1.2%, or $0.94, to $77.82 per barrel.
Manufacturing and Real Estate Depend on Lower Rates
While certain sectors of the economy are doing well and remain resilient, weakness in rate sensitive manufacturing and real estate will begin to spread to the overall labor market and economy in the coming months. The longer the Fed takes to cut, the greater the risk that recessionary conditions in these capital-intensive sectors will spillover to the general economy. Another risk lies in the regional banking space, with incrementally delayed rate cuts possibly leading to an accident similar to what occurred last March. This time though, it’s not just long-duration securities that are a problem; there’s are also huge commercial real estate exposures lurking. Finally, this CPI is extending our long and risky journey across the monetary policy bridge, with market players forgetting about the first rate cut in March or May and penciling in June as the month when the initial rate reduction finally arrives. Market bulls hope that there isn’t an accident by then.
Visit Traders’ Academy to Learn More About the Consumer Price Index and Other Economic Indicators.
Disclosure: Interactive Brokers
Information posted on IBKR Campus that is provided by third-parties does NOT constitute a recommendation that you should contract for the services of that third party. Third-party participants who contribute to IBKR Campus are independent of Interactive Brokers and Interactive Brokers does not make any representations or warranties concerning the services offered, their past or future performance, or the accuracy of the information provided by the third party. Past performance is no guarantee of future results.
This material is from IBKR Macroeconomics and is being posted with its permission. The views expressed in this material are solely those of the author and/or IBKR Macroeconomics and Interactive Brokers is not endorsing or recommending any investment or trading discussed in the material. This material is not and should not be construed as an offer to buy or sell any security. It should not be construed as research or investment advice or a recommendation to buy, sell or hold any security or commodity. This material does not and is not intended to take into account the particular financial conditions, investment objectives or requirements of individual customers. Before acting on this material, you should consider whether it is suitable for your particular circumstances and, as necessary, seek professional advice.
