As an investor, you may well naturally prefer to think about profit first!
Nevertheless, avoiding losses is just as important, because making up for loss can be difficult.
You are probably familiar with common loss limitation measures, such as diversification or the use of stop losses. At Seasonax, we always advise you to take such measures.
Today, however, I would like to show you how to recognize seasonal patterns that look good at first glance, but are actually bad – and which you should not act on.
106.09% annualized profit – nevertheless no seasonal recommendation.
As an example, I have selected Infineon Technologies, a German semiconductor manufacturer. Take a look at the Seasonax screenshot. The annualized return of 106.09% from March 10 to May 7 is very good over 25 years (see green circle).
Seasonax screenshot, Infineon Technologies
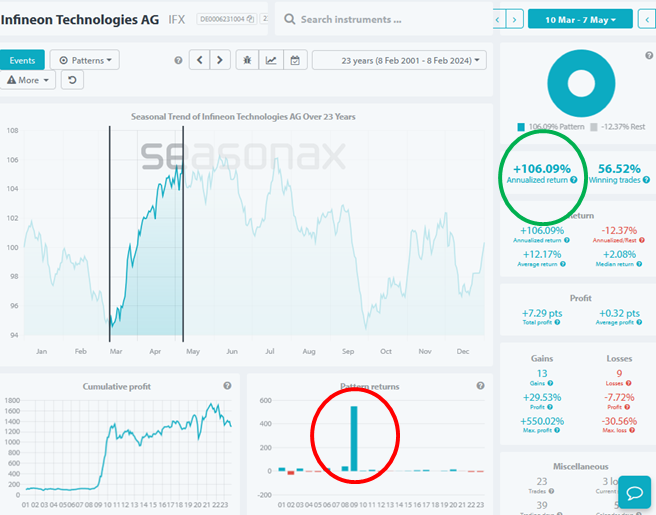
A promising pattern at first glance. Source: Seasonax
But also pay attention to the red circle. It shows you that there was a far supra-regional rise in 2009. In fact, the company was a bankruptcy candidate and penny stock at the beginning of 2009 – the share price was significantly less than one euro. But then things turned around and the share price shot up.
Filter out exceptional years!
However, this increase has nothing to do with seasonality! It would therefore be pointless to rely on it in a seasonal analysis.
To see the seasonal trend without such exceptional years, you can simply filter them out.
To do this, go to “More”, then “All” and then filter out the exceptional year by clicking on it. The next chart shows you the result.
Seasonax screenshot, Infineon Technologies, without 2009
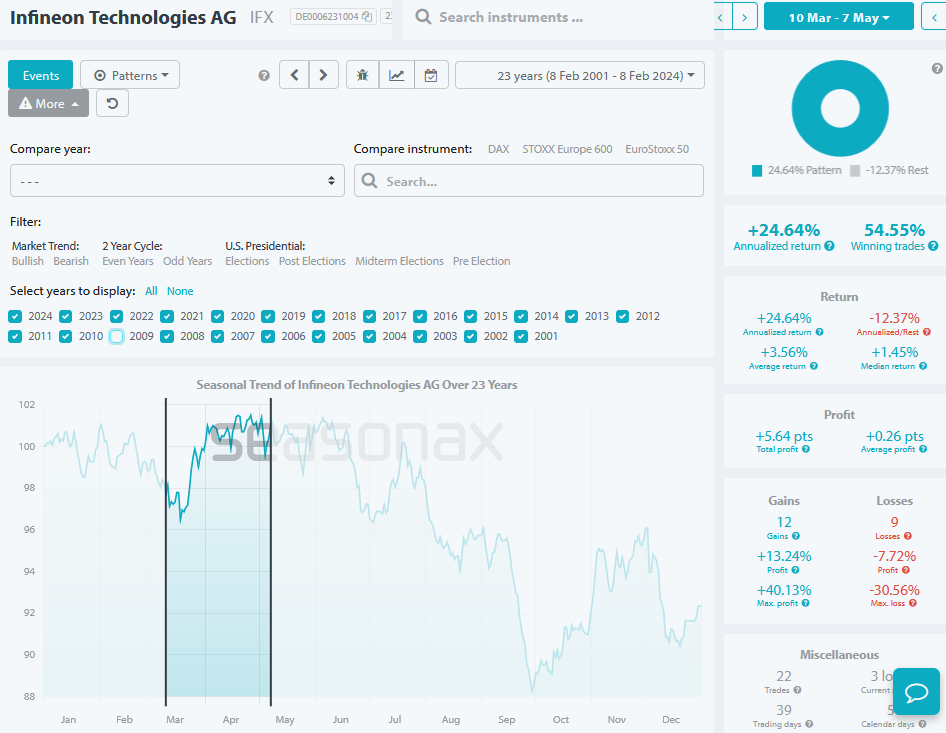
Without the exceptional year, little remains. Source: Seasonax
The increase is now significantly lower. The annualized return without 2009 is indeed only 24.64%, four times less than the original 106.04% figure. There are better seasonal patterns than this.
How to avoid bad seasonal patterns
It is therefore not only the total yield that matters, but also the distribution of the individual yields. The more even the distribution is, the more likely it is to be a genuine seasonal pattern. You can see the distribution in the bar chart “Pattern return”. An even increase under “Cumulative profit” also shows you that the seasonal pattern has recurred year after year. A high hit rate under “winning trades” likewise indicates this.
By looking at the distribution, you can recognize bad seasonal patterns and more effectively avoid losses.
Instead, you can take advantage of good seasonal phases with high yields and relatively even distribution, without outliers!
—
Originally Posted February 21, 2024 – How Can I Find Really Bad Seasonal Patterns?
Disclosure: Seasonax
Past results and past seasonal patterns are no indication of future performance, in particular, future market trends. Seasonax GmbH neither recommends nor approves of any particular financial instrument, group of securities, segment of industry, analysis interval or any particular idea, approach, strategy or attitude nor provides consulting nor brokerage nor asset management services. Seasonax GmbH hereby excludes any explicit or implied trading recommendation, in particular, any promise, implication or guarantee that profits are earned and losses excluded, provided, however, that in case of doubt, these terms shall be interpreted in abroad sense. Any information provided by Seasonax GmbH or on this website or any other kind of data media shall not be construed as any kind of guarantee, warranty or representation, in particular as set forth in a prospectus. Any user is solely responsible for the results or the trading strategy that is created, developed or applied. Indicators, trading strategies and functions provided by seasonax GmbH or on this website or any other kind of data media may contain logical or other errors leading to unexpected results, faulty trading signals and/or substantial losses. Seasonax GmbH neither warrants nor guarantees the accuracy, completeness, quality, adequacy or content of the information provided by it or on this website or any other kind of data media. Any user is obligated to comply with any applicable capital market rules of the applicable jurisdiction. All published content and images on this website or any other kind of data media are protected by copyright. Any duplication, processing, distribution or any form of utilisation beyond the scope of copyright law shall require the prior written consent of the author or authors in question. Futures and forex trading contains substantial risk and is not for every investor. An investor could potentially lose all or more than the initial investment. Risk capital is money that can be lost without jeopardizing ones’ financial security or lifestyle. Only risk capital should be used for trading and only those with sufficient risk capital should consider trading. Past performance is not necessarily indicative of future results. Testimonials appearing on this website may not be representative of other clients or customers and is not a guarantee of future performance or success.
Disclosure: Interactive Brokers
Information posted on IBKR Campus that is provided by third-parties does NOT constitute a recommendation that you should contract for the services of that third party. Third-party participants who contribute to IBKR Campus are independent of Interactive Brokers and Interactive Brokers does not make any representations or warranties concerning the services offered, their past or future performance, or the accuracy of the information provided by the third party. Past performance is no guarantee of future results.
This material is from Seasonax and is being posted with its permission. The views expressed in this material are solely those of the author and/or Seasonax and Interactive Brokers is not endorsing or recommending any investment or trading discussed in the material. This material is not and should not be construed as an offer to buy or sell any security. It should not be construed as research or investment advice or a recommendation to buy, sell or hold any security or commodity. This material does not and is not intended to take into account the particular financial conditions, investment objectives or requirements of individual customers. Before acting on this material, you should consider whether it is suitable for your particular circumstances and, as necessary, seek professional advice.
