Agnieszka Konwent-Morawski and Brent Olson look at seasonal patterns in high yield bonds and how the next few months might develop.
Key takeaways:
- Modest returns in March for high yield bonds have historically been followed by strong returns in April – typically the best performing month of the year.
- Patterns in issuance (supply) and demand may partly account for returns but we also need to recognise that events can skew returns.
- Consequently, while the economic backdrop and supply/demand outlook currently appear supportive we need to be mindful of both positive and negative event risks in the coming months.
Is there some seasonality to performance in high yield corporate bonds? April has historically been the most rewarding month to hold high yield bonds so should we anticipate a spring bounce for the asset class?
Figure 1 below shows the average monthly total return on the ICE BofA Global High Yield Index. There is something of a quarterly pattern, with high yield typically doing well in the first month of each quarter (except for Q3). Potential explanations for this might be customary blackout periods ahead of earnings releases leading to lower issuance in those months, and heavier coupon reinvestment in January and July creating demand for bonds. Similarly, the relatively weaker returns in the summer months might be attributed to a pick-up in issuance ahead of the vacation period, together with fewer investment professionals at their desks over summer affecting risk sentiment and liquidity.
Figure 1: Average monthly returns on global high yield
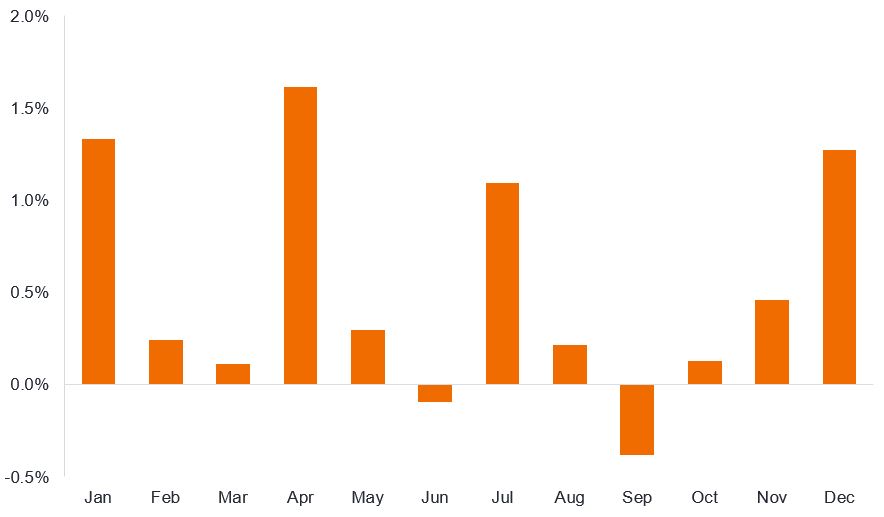
Source: Bloomberg, ICE BofA Global High Yield Index, total return in US dollars, 1 January 1998 to 31 December 2024. Past performance does not predict future returns.
It is bit simplistic to lay it all down to a few factors. A glance through history shows that key events played a role in shaping returns. Figure 2 isolates the largest monthly moves up and down, showing the year in which it occurred. The moves are intuitive. For example, we can quickly recognise the sell-off in March 2020 as the COVID pandemic spooked markets, or the collapse of Lehman Brothers in September 2008 and its aftermath a month later that shook market resilience. Conversely, from April and May 2009, we have the big rebound in risk appetite as co-ordinated intervention by authorities globally began to heal markets following the Global Financial Crisis.
Figure 2: Largest returns (+/-) in each month in global high yield (years shown in italics)
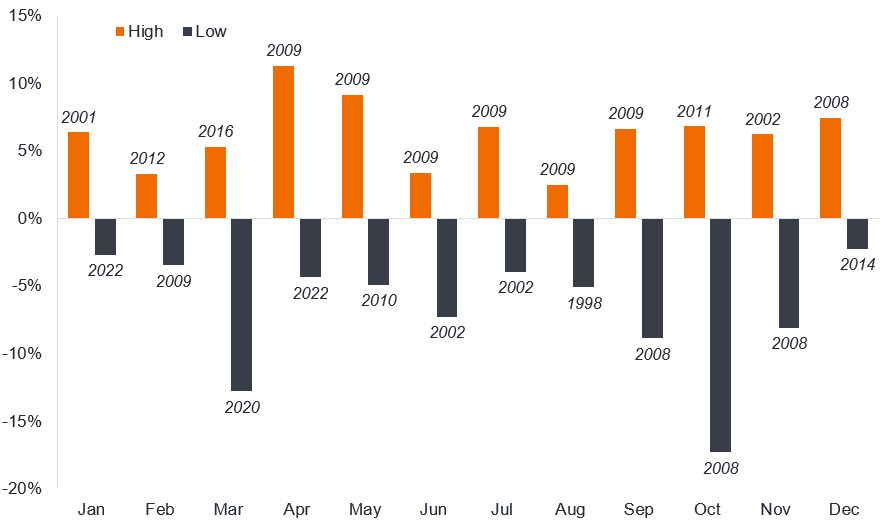
Source: Bloomberg, ICE BofA Global High Yield Index, total return in US dollars, 1 January 1998 to 31 December 2024. Past performance does not predict future returns.
We can take the analysis a step further and compare how high yield does relative to government bonds (this is known as the excess return). It should be noted that excess return for the index is quite a complex calculation as each constituent bond in the index is risk-matched against a corresponding government bond.
For this exercise, instead of showing average return, we can look at median return (which eliminates extremes). As Figure 3 shows, once again, April is a strong month, delivering positive excess returns in 22 of the last 27 years (81%). Outside of June and August, the chart shows that high yield bonds have historically typically beaten returns on government bonds. Mathematically, that makes sense. For the 27-year period covered in the chart below, the ICE Global High Yield Index delivered a total return of 381% whilst the ICE US Treasury Index returned 157%.1 We should expect high yield to have more positive than negative months in total and for excess returns on average to be significantly greater than zero over time.
Figure 3: Global high yield bond excess returns over government bonds
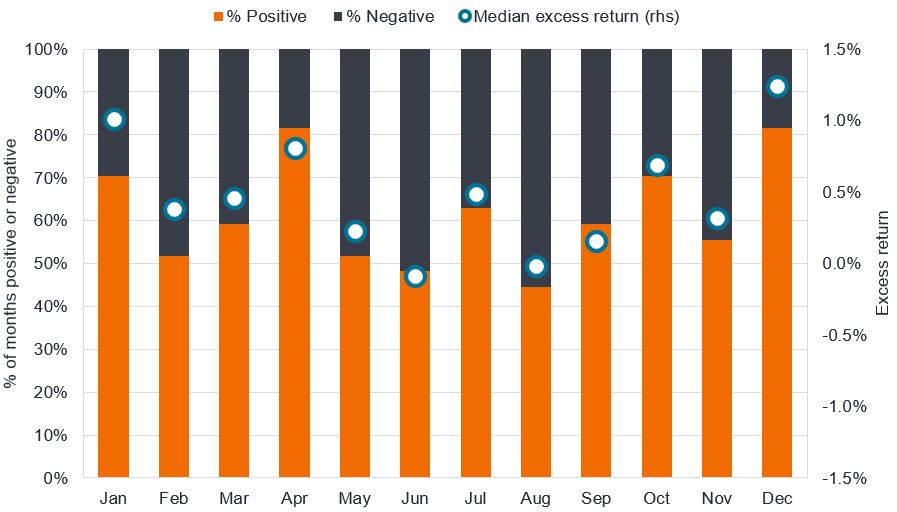
Source: Bloomberg, ICE BofA Global High Yield, median monthly excess return % versus Govts, 1 January 1998 to 31 December 2024. The median is the middle return in a data set. Past performance does not predict future returns.
Missing supply
Gross supply of high yield bonds tends to moderate in April after a pick-up in March before a fresh pick-up going into summer. What is interesting so far this year is that an anticipated rise in supply has failed to materialise. In the first six weeks of 2025 there was just US$29 billion of gross non-financial issuance in US high yield, compared with US$37 billion for the same period in 2024. Similarly, in Europe there was just €5 billion of gross non-financial issuance in Euro high yield in the first six weeks of 2025, compared with €6 billion last year.2
If supply continues at current levels, then it may undershoot expectations. It is possible that fewer interest rate cuts in the US (higher for longer) means more companies will look to finance capital expenditure (capex) plans from internal cash flow rather than via debt. Concerns about tariffs (taxes applied to imports) may also be restraining animal spirits. With some key deadlines on tariffs taking effect in March (4 March – Canada and Mexico; 12 March – broader steel and aluminium tariffs) and April (report on reciprocal tariffs between the US and other countries) this might explain corporate reticence, although the Conference Board’s measure of Chief Executive Office (CEO) confidence increased notably in Q1 2025 (February 2025 release).
The risk here is that supply is not abandoned but gets compressed into the fewer remaining months of the year. That said, in recent years we have seen borrowers often look beyond the public high yield bond markets towards private credit, banks and syndicated loans as sources of funding, so we would welcome additional high yield bond supply. We think there is enough appetite for high yield to avoid indigestion but with credit spreads (the difference between the yield on a corporate bond and a government bond of similar maturity) at relatively tight levels, there is potential for some volatility heading into summer.
Ongoing demand
The supply may be missing but the demand is not. Industry fund flows into high yield have been buoyant recently, with a combined net US$3.9 billion entering Euro and US High yield mutual funds and exchange traded funds in the four weeks to 14 February 2025.3
There are plenty of reasons to own high yield bonds. The growth and inflation dynamics remain favourable for US high yield. So far earnings have been robust. In fact, by mid-February, with 77% of S&P 500 companies reporting actual results, the year-on-year earnings growth for Q4 2024 was 16.9%, the highest result since Q4 2021. Furthermore, bottom-up earnings expectations for the US for Q1 2025 have been downgraded, creating a low bar to beat earnings when they are released in April/May.4
For Europe, the European Central Bank remains firmly in rate-cutting mode which should help drive refinancing activity. A possible resolution of the war in Ukraine would be a positive risk event, potentially driving down energy prices in the continent and generating reconstruction opportunities. There is also the possibility of Germany undertaking fiscal stimulus if the composition of its government changes in the February election. Both events have the potential to boost revenues among high yield borrowers.
With the default outlook appearing benign, investors are prepared to overlook tight credit spreads and focus on the relatively attractive yield that high yield bonds offer, currently 7.2% in the US and 5.2% in Europe.5 We remain cautiously optimistic towards the asset class but with credit spreads tight, security selection is becoming increasingly important to performance.
—
Originally Posted February 21, 2025 – Seasonality and supply: Will there be a spring bounce for high yield bonds?
1Source: Bloomberg, ICE BofA Global High Yield Index, ICE BofA US Treasury Index, total return in US dollars, 31 December 1997 to 31 December 2024. Total return comprises both income and capital gain over the period. Past performance does not predict future returns.
2Source: HSBC, Dealogic, 17 February 2025.
3Source: HSBC, Lipper, 12 February 2025.
4Source: Factset, Earnings Insight, 14 February 2025.
5Source: Bloomberg, ICE BofA US High Yield Index, ICE BofA Euro High Yield Index, yield to worst at 18 February 2025. Yields may vary over time and are not guaranteed.
IMPORTANT INFORMATION
Fixed income securities are subject to interest rate, inflation, credit and default risk. The bond market is volatile. As interest rates rise, bond prices usually fall, and vice versa. The return of principal is not guaranteed, and prices may decline if an issuer fails to make timely payments or its credit strength weakens.
High-yield or “junk” bonds involve a greater risk of default and price volatility and can experience sudden and sharp price swings. products, such as mortgage- and asset-backed securities.
Disclosure: Janus Henderson
The opinions and views expressed are as of the date published and are subject to change without notice. They are for information purposes only and should not be used or construed as an offer to sell, a solicitation of an offer to buy, or a recommendation to buy, sell or hold any security, investment strategy or market sector. No forecasts can be guaranteed. Opinions and examples are meant as an illustration of broader themes and are not an indication of trading intent. It is not intended to indicate or imply that any illustration/example mentioned is now or was ever held in any portfolio. Janus Henderson Group plc through its subsidiaries may manage investment products with a financial interest in securities mentioned herein and any comments should not be construed as a reflection on the past or future profitability. There is no guarantee that the information supplied is accurate, complete, or timely, nor are there any warranties with regards to the results obtained from its use. Past performance is no guarantee of future results. Investing involves risk, including the possible loss of principal and fluctuation of value.
Disclosure: Interactive Brokers Third Party
Information posted on IBKR Campus that is provided by third-parties does NOT constitute a recommendation that you should contract for the services of that third party. Third-party participants who contribute to IBKR Campus are independent of Interactive Brokers and Interactive Brokers does not make any representations or warranties concerning the services offered, their past or future performance, or the accuracy of the information provided by the third party. Past performance is no guarantee of future results.
This material is from Janus Henderson and is being posted with its permission. The views expressed in this material are solely those of the author and/or Janus Henderson and Interactive Brokers is not endorsing or recommending any investment or trading discussed in the material. This material is not and should not be construed as an offer to buy or sell any security. It should not be construed as research or investment advice or a recommendation to buy, sell or hold any security or commodity. This material does not and is not intended to take into account the particular financial conditions, investment objectives or requirements of individual customers. Before acting on this material, you should consider whether it is suitable for your particular circumstances and, as necessary, seek professional advice.
Disclosure: Mutual Funds
Mutual Funds are investments that pool the funds of investors to purchase a range of securities to meet specified objectives, such as growth, income or both. Investors are reminded to consider the various objectives, fees, and other risks associated with investing in Mutual Funds. Please read the prospectus accordingly. This communication is not to be construed as a recommendation, solicitation or promotion of any specific fund, or family of funds. Interactive Brokers may receive compensation from fund companies in connection with purchases and holdings of mutual fund shares. Such compensation is paid out of the funds’ assets. However, IBKR does not solicit you to invest in specific funds and does not recommend specific funds or any other products to you. For additional information please visit https://www.interactivebrokers.com/en/index.php?f=1563&p=mf
