Earnings season is kicking into high gear this week with about 75 members of the S&P 500 (SPX) index reporting. The market loved what it heard after yesterday’s close from Netflix (NFLX), a former market darling during the “FAANG” days, and that stock is rocketing 12% higher today. Today we hear from another market darling, a Magnificent 7 stock whose recent performance has been less than stellar over the past few weeks. That of course is Tesla (TSLA).
TSLA is perpetually the most active stock at our firm, a testament to the outsized hold that it has on investor psychology. I have frequently referred to TSLA as a “faith-based” stock, and over the long run, investors’ faith in TSLA and its founder Elon Musk has been richly rewarded.
But investments are forward-looking. As we’ve all heard, past performance is no guarantee of future results. TSLA’s stellar long-term performance means little to investors who need to continually reassess a company’s immediate and future prospects. We’ll get some clues about them later today.
Consensus estimates for 4Q earnings per share are $0.73 on sales of $25.6 billion. That compares to year-ago EPS of $1.19 on $24.3 billion. Even a cursory glance at this comparison reveals the fundamental issue that faces TSLA: margin pressure. Revenues are expected to grow by 5.3% versus last year but EPS are expected to drop by over 38%. Investors prefer when growth stocks actually grow their profits.
Yet as is often the case with TSLA, the desired metrics are likely other than strictly about EPS and revenues. It is hoped that gross margins can rise to 16.7% or more, after last quarter’s 16.3%. Analysts also want to hear about anticipated deliveries for 2024, and whether those will meet or exceed the 2.1-2.2 million that are currently anticipated.
The stakes for investors can be quite high. The last six reports from TSLA brought post-earnings moves of -9.3%, -9.74%, -9.75%, +10.97%, -6.65%, and +9.78%. Somehow, implied volatilities for at-money options expiring this week are roughly 7.25% on a daily basis — well below the recent 9.37% average move – as shown by the graphs below:
TSLA Volatility Term Structure
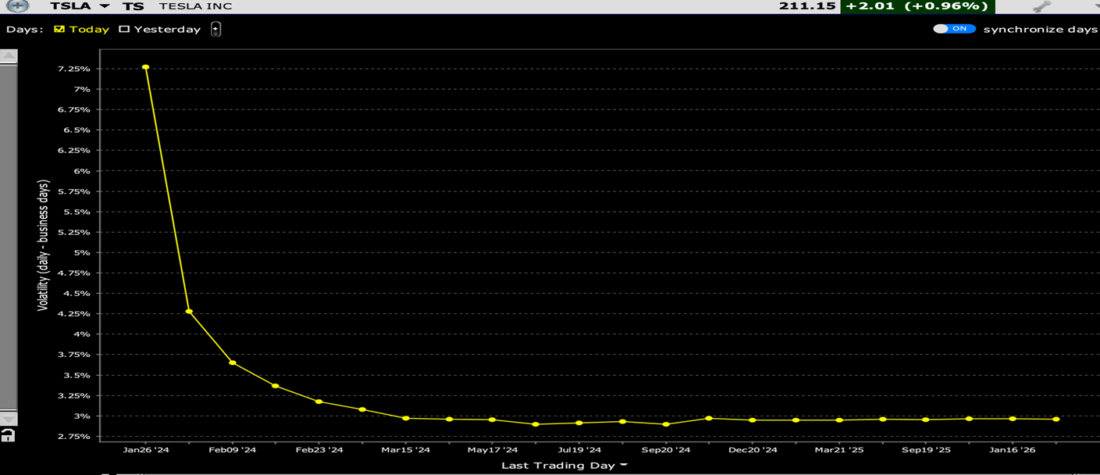
Source: Interactive Brokers
TSLA Implied Volatilities by Strike, Options Expiring January 26th (top), February 2nd (middle), February 16th (bottom)
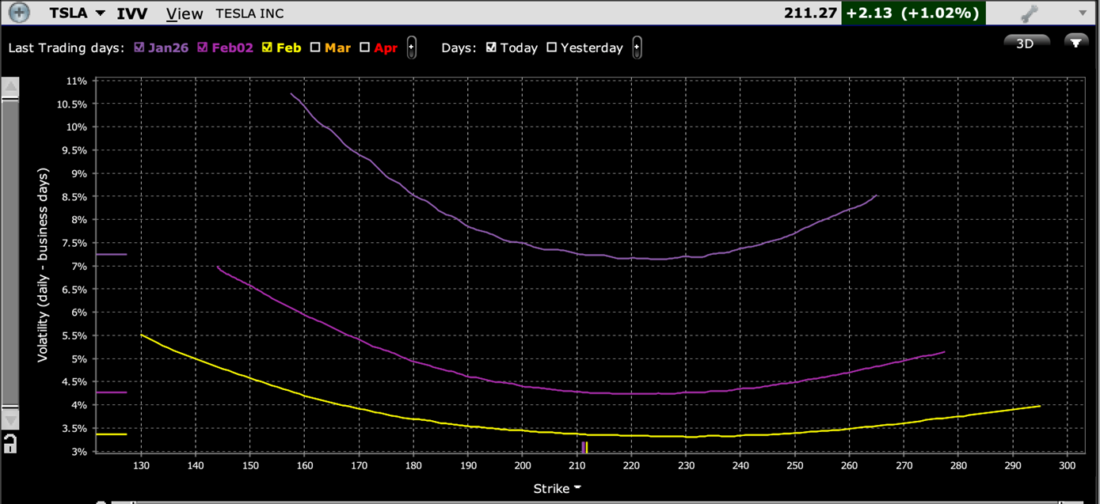
Source: Interactive Brokers
The graph directly above shows that skews in near-term options are generally flattish. There is some added risk aversion priced into downside options. That is not unusual for most stocks ahead of earnings, though we have often seen TSLA with even flatter or even upside skews ahead of results. This is captured by the IBKR Probability Lab for this week’s expiry, as shown in the graph below, where we see an almost perfectly symmetrical set of outcomes centered around the current level of the stock:
IBKR Probability Lab for TSLA Options Expiring January 26, 2024
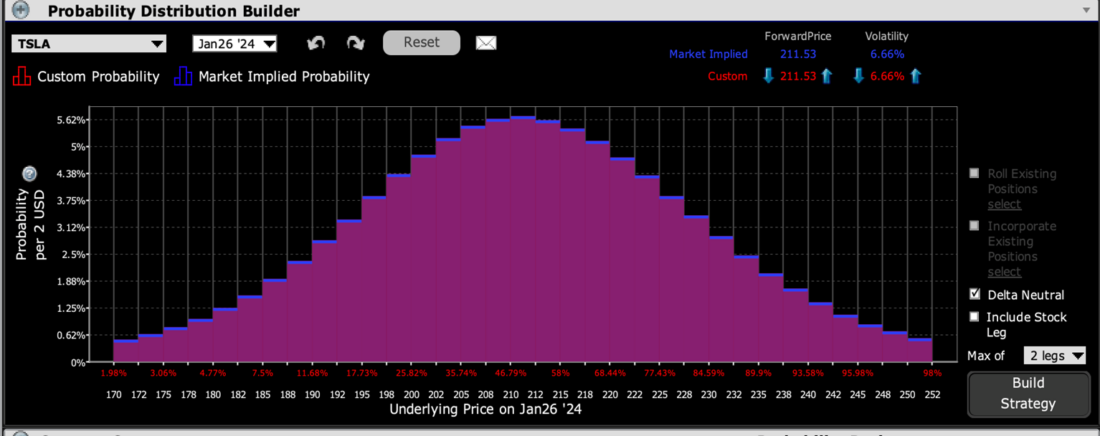
Source: Interactive Brokers
The bottom line here is that there does not appear to be an inordinate amount of risk aversion, or a significant directional view priced into the stock. Quite frankly, I am surprised to see that more optimistic expectations are not priced in right now, considering the persistent optimism that surrounds TSLA and the thought that the stock is “due” for a positive surprise after three consecutive large disappointments. Could the lack of anticipation be a sign that investors would be more surprised by good news than bad? It’s unclear now, but will be quite clear by this time tomorrow.
Disclosure: Interactive Brokers
The analysis in this material is provided for information only and is not and should not be construed as an offer to sell or the solicitation of an offer to buy any security. To the extent that this material discusses general market activity, industry or sector trends or other broad-based economic or political conditions, it should not be construed as research or investment advice. To the extent that it includes references to specific securities, commodities, currencies, or other instruments, those references do not constitute a recommendation by IBKR to buy, sell or hold such investments. This material does not and is not intended to take into account the particular financial conditions, investment objectives or requirements of individual customers. Before acting on this material, you should consider whether it is suitable for your particular circumstances and, as necessary, seek professional advice.
The views and opinions expressed herein are those of the author and do not necessarily reflect the views of Interactive Brokers, its affiliates, or its employees.
Disclosure: Options Trading
Options involve risk and are not suitable for all investors. Multiple leg strategies, including spreads, will incur multiple commission charges. For more information read the “Characteristics and Risks of Standardized Options” also known as the options disclosure document (ODD) or visit ibkr.com/occ
