There are two ways in which our looming fiscal catastrophe draws closer. One is through the passage of time, as entitlements grow with more aging Medicare recipients. The other is through worsening projections from the Congressional Budget Office (CBO).
Both are happening.
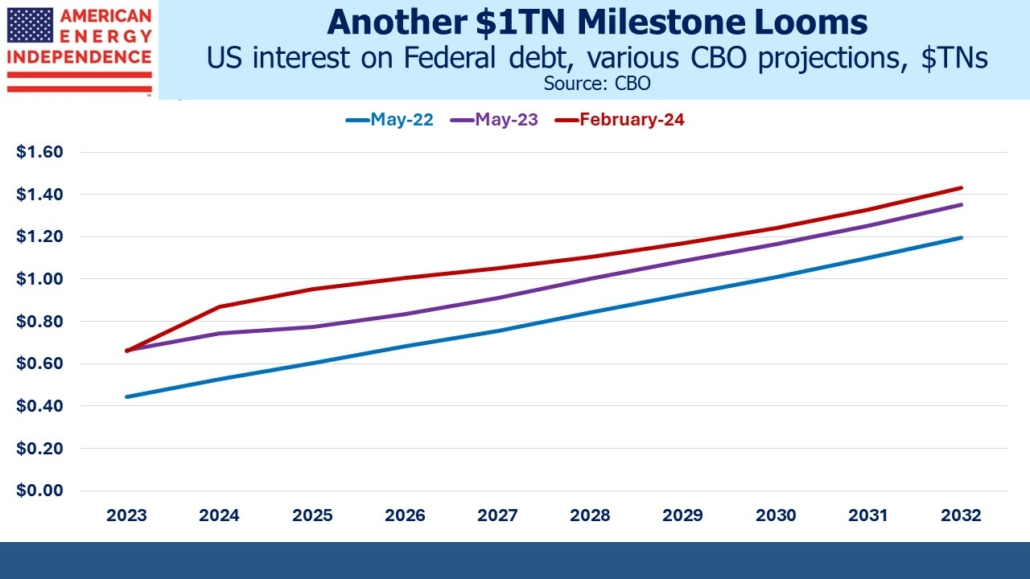
Start with interest expense. In the CBO’s May 2022 ten year Budget and Economic Outlook, this line item was forecast to hit $1TN in 2030, eight years hence. Last May, the CBO brought this date closer by two years, to 2028. And in the February outlook just released it’s now 2026. Since 2022 the $1TN date has gone from eight years out to just two.
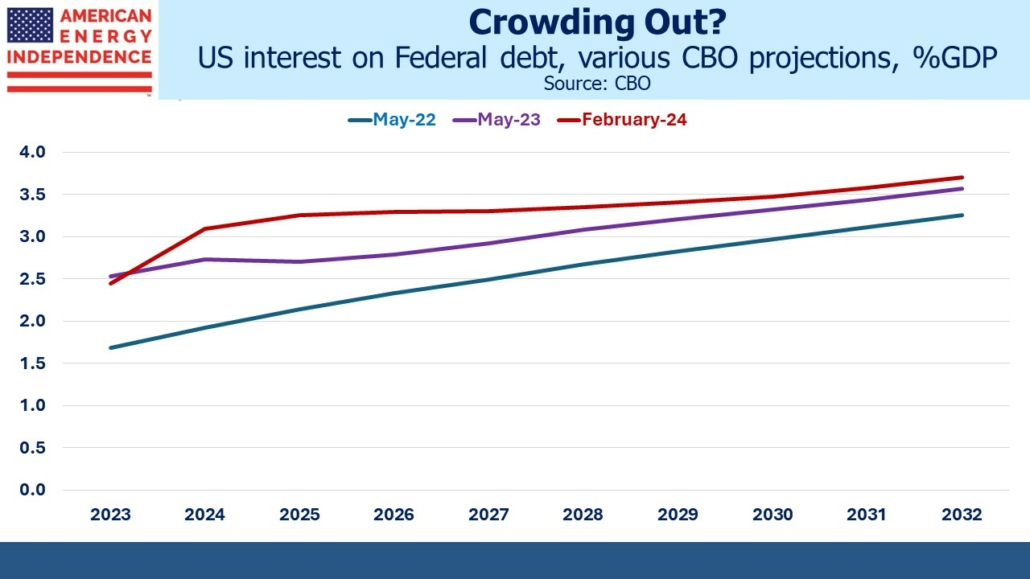
Inflation ran higher than projected in 2022, which also pushed up nominal GDP. But even as a % of GDP, the interest expense figures have worsened. This year we’ll spend 3.1% of GDP on interest, rising to 3.7% in 2032.
Projections for the Fed’s balance sheet are moving higher as well. Ever since Ben Bernanke unleased Quantitative Easing (QE) during the 2008 Great Financial Crisis (GFC), the Fed has struggled to bring its bond holdings back down to the level that’s needed to operate monetary policy. Fearful of causing a spike in bond yields, they rely on maturing bonds rolling off to shrink their holdings.

The Fed’s balance sheet is currently $7.7TN, of which $4.7TN is US treasury securities. Most of the balance is Mortgage-Backed Securities (MBS). Two years ago, the CBO expected the Fed’s holdings of US treasuries to drop to $3.3TN by 2025. Now they’re projecting $4.4TN and expect it to be back at $4.7TN by 2026. An excessive balance sheet has become an enduring feature of our monetary policy.

When such holdings become permanent it represents a partial monetization of our debt. Moreover, the Fed’s % of outstanding government debt is now projected to be 19% by 2032, 4% higher than the CBO was forecasting a couple of years ago.
The CBO doesn’t forecast MBS holdings, but virtually all these securities have an average life greater than ten years. Prepayments will knock this down, but MBS has also become a permanent item on the Fed’s balance sheet.

The CBO assumes real GDP growth of 2.0% pa. Recessions are usually unexpected and forecasting them is hard. But when the next one occurs, ample fiscal stimulus will be part of the solution and inevitably the Fed will feel compelled to start QE again.
The only good thing about our deteriorating fiscal outlook is that the perennially forecast day of reckoning hasn’t come. We’re still muddling along. We’re about to head up the steep path into unknown territory as shown in the last chart.

Federal debt held by the public will reach 99% this year and is headed higher. However, when adjusted by Federal financial assets and debt held by the Federal Reserve it’s 75%. Japan’s equivalent figure is 119%.
Japan’s defining economic challenge over the past couple of decades has been deflation. GDP growth averaged less than 0.5% pa over the past decade. Many economists blame this partly on their high levels of government debt.
It’s unlikely an extended period of anemic growth would be politically acceptable in the US. The depression of the 1930s defines American economic policy, in that every president is expected to preside over economic growth. Germany’s equivalent is avoiding a repeat of the inflation of the 1930s under the Weimar Republic that led to Hitler’s ascent.
Japanese voters have accepted mediocre GDP growth far longer than would be the case in the US. If excessive US debt led to Japanese-style deflation here, fiscal stimulus and QE would quickly follow.
How this issue resolves itself is of great importance to the long term investor. QE depresses long term yields and impedes the Fed in its ability to constrain growth when inflation is above target. Barry Knapp of Ironsides Macroeconomics regularly warns about the harm to profitability of all but the biggest US banks caused by the persistent inversion of the 3 Month/10 Year portion of the yield curve. Loans priced off the long end of the treasury curve don’t yield enough to generate acceptable profits for banks whose marginal cost of wholesale funding is close to the Fed Funds rate.
And yet US economic growth remains strong with unemployment low. An unintended consequence of QE is the pressure the Fed’s bond holdings put on regional bank profitability by keeping yields low. It also probably means they need tighter monetary policy than would otherwise be the case at the short end, since long-term yields aren’t that restrictive.
Inflation expectations are the likely casualty rather than GDP growth. Eventually our excessive debt along with increasing debt monetization will cause slow but steady currency debasement, the time-honored refuge of profligate governments. We believe owning infrastructure and other real assets is how investors should position themselves.
—
Originally Posted February 21, 2024 – Our Darkening Fiscal Outlook
Important Disclosures
The information provided is for informational purposes only and investors should determine for themselves whether a particular service, security or product is suitable for their investment needs. The information contained herein is not complete, may not be current, is subject to change, and is subject to, and qualified in its entirety by, the more complete disclosures, risk factors and other terms that are contained in the disclosure, prospectus, and offering. Certain information herein has been obtained from third party sources and, although believed to be reliable, has not been independently verified and its accuracy or completeness cannot be guaranteed. No representation is made with respect to the accuracy, completeness or timeliness of this information. Nothing provided on this site constitutes tax advice. Individuals should seek the advice of their own tax advisor for specific information regarding tax consequences of investments. Investments in securities entail risk and are not suitable for all investors. This site is not a recommendation nor an offer to sell (or solicitation of an offer to buy) securities in the United States or in any other jurisdiction.
References to indexes and benchmarks are hypothetical illustrations of aggregate returns and do not reflect the performance of any actual investment. Investors cannot invest in an index and do not reflect the deduction of the advisor’s fees or other trading expenses. There can be no assurance that current investments will be profitable. Actual realized returns will depend on, among other factors, the value of assets and market conditions at the time of disposition, any related transaction costs, and the timing of the purchase. Indexes and benchmarks may not directly correlate or only partially relate to portfolios managed by SL Advisors as they have different underlying investments and may use different strategies or have different objectives than portfolios managed by SL Advisors (e.g. The Alerian index is a group MLP securities in the oil and gas industries. Portfolios may not include the same investments that are included in the Alerian Index. The S & P Index does not directly relate to investment strategies managed by SL Advisers.)
This site may contain forward-looking statements relating to the objectives, opportunities, and the future performance of the U.S. market generally. Forward-looking statements may be identified by the use of such words as; “believe,” “expect,” “anticipate,” “should,” “planned,” “estimated,” “potential” and other similar terms. Examples of forward-looking statements include, but are not limited to, estimates with respect to financial condition, results of operations, and success or lack of success of any particular investment strategy. All are subject to various factors, including, but not limited to general and local economic conditions, changing levels of competition within certain industries and markets, changes in interest rates, changes in legislation or regulation, and other economic, competitive, governmental, regulatory and technological factors affecting a portfolio’s operations that could cause actual results to differ materially from projected results. Such statements are forward-looking in nature and involves a number of known and unknown risks, uncertainties and other factors, and accordingly, actual results may differ materially from those reflected or contemplated in such forward-looking statements. Prospective investors are cautioned not to place undue reliance on any forward-looking statements or examples. None of SL Advisors LLC or any of its affiliates or principals nor any other individual or entity assumes any obligation to update any forward-looking statements as a result of new information, subsequent events or any other circumstances. All statements made herein speak only as of the date that they were made. r
Certain hyperlinks or referenced websites on the Site, if any, are for your convenience and forward you to third parties’ websites, which generally are recognized by their top level domain name. Any descriptions of, references to, or links to other products, publications or services does not constitute an endorsement, authorization, sponsorship by or affiliation with SL Advisors LLC with respect to any linked site or its sponsor, unless expressly stated by SL Advisors LLC. Any such information, products or sites have not necessarily been reviewed by SL Advisors LLC and are provided or maintained by third parties over whom SL Advisors LLC exercise no control. SL Advisors LLC expressly disclaim any responsibility for the content, the accuracy of the information, and/or quality of products or services provided by or advertised on these third-party sites.
All investment strategies have the potential for profit or loss. Different types of investments involve varying degrees of risk, and there can be no assurance that any specific investment will be suitable or profitable for a client’s investment portfolio.
Past performance of the American Energy Independence Index is not indicative of future returns.
Disclosure: SL Advisors
Please go to following link for important legal disclosures: http://sl-advisors.com/legal-disclosure
SL Advisors is invested in all the components of the American Energy Independence Index via the ETF that seeks to track its performance.
Disclosure: Interactive Brokers
Information posted on IBKR Campus that is provided by third-parties does NOT constitute a recommendation that you should contract for the services of that third party. Third-party participants who contribute to IBKR Campus are independent of Interactive Brokers and Interactive Brokers does not make any representations or warranties concerning the services offered, their past or future performance, or the accuracy of the information provided by the third party. Past performance is no guarantee of future results.
This material is from SL Advisors and is being posted with its permission. The views expressed in this material are solely those of the author and/or SL Advisors and Interactive Brokers is not endorsing or recommending any investment or trading discussed in the material. This material is not and should not be construed as an offer to buy or sell any security. It should not be construed as research or investment advice or a recommendation to buy, sell or hold any security or commodity. This material does not and is not intended to take into account the particular financial conditions, investment objectives or requirements of individual customers. Before acting on this material, you should consider whether it is suitable for your particular circumstances and, as necessary, seek professional advice.
