By: Carl Kaufman, Bradley Kane and Craig Manchuck
The market performed well in 2023, but inflation will likely remain a top concern for both the Fed and investors throughout the new year.
Where Are We Going?
2023 was a pleasant reminder that bad times do not last forever. In stark contrast to 2022, when most asset returns were negative in response to Fed tightening, most asset classes rebounded despite continued tightening throughout most of the year. Have the markets become inured to higher interest rates? Can the economy keep growing despite tighter monetary policy? How soon will inflation get to and remain at the Fed’s 2% target? While no one has definitive answers to these questions, there is no shortage of opinions on the future path of economic growth and the direction of interest rates, both of which should determine future returns.
When the Fed paused its tightening program in September, the narrative switched from how many more hikes to forecasting how soon cuts in the fed funds rate would happen. As is typical for shifts in sentiment, the fear of missing out (FOMO) on the next move in the markets became palpable as markets rallied in the fourth quarter. The S&P 500 almost topped its all-time high, high yield and treasury markets rallied, and predictions of rate cuts as early as March 2024 catalyzed the buying frenzy. The yield on the 10-year Treasury declined by over 113 basis points versus the highs on October 23rd while the S&P 500 rallied 16.2% to 4,769 versus its quarter’s low on October 27th, not quite matching the all-time closing high of 4,818 on January 4th, 2021, which was the result of massive fiscal and monetary Covid-induced stimulus. Rallies of this magnitude in risk assets, like high yield and equities, typically happen when economic outlooks brighten, and recessions are on the distant horizon. Treasuries don’t usually rally hard with that outlook. Does the market broadly have the correct call for equities or Treasuries? What are we missing?
The drop in inflation, as measured by the Consumer Price Index (CPI), is a big factor driving this rally. The thinking is that if inflation keeps dropping to the Fed’s 2% target that they will ease rates, which feeds into valuations (higher). Treasuries are also discounting lower rates but that is simply arithmetic at this point, not yet a prediction of economic weakness. Stay tuned. The year-on-year pace of reported inflation (based on CPI) has more than halved since the end of 2022 from 6.5% to 3.1%. Core CPI (excluding food and energy) has also declined, but not as much, from 5.7% at year-end 2022 to 4.0% for the latest reading. Both are not yet at the Fed’s 2% target. The Fed will likely need to see inflation stay near 2% for a period of time before cutting rates or they may risk a repeat of the 1970s, where they added stimulus prematurely and suffered a second wave of inflation. While they have a long history of policy mistakes, we feel that cutting rates in March could be premature. The question remains, what is the underlying trend that keeps rates and inflation low? The key is the pace of economic growth, which will likely determine the future path of inflation and interest rates.
As we stated, strong rallies in risk assets like we saw in the fourth quarter usually portend strong economic growth, not an impending recession. While we do not yet have 4th quarter real GDP, the previous four quarters, with revisions, were up 0.7%, 1.7%, 2.4% and 2.9% respectively, showing an accelerating sequential pace of growth. Nominal GDP for the same periods was 7.1%, 7.1%, 5.9% and 6.2%, showing healthy growth. While we do not know what the future may bring, at this point it seems the economy is coping reasonably well with higher interest rates and geopolitical unrest. Let’s hope it continues to do so.
Despite favorable GDP growth, an increasing number of pundits are calling for a “soft landing” or worse – likely the same Cassandras who made the predictions last year – a bit like a broken clock. Supposing they are correct, does it not follow that corporate earnings would weaken? If that were the case, should equity markets come off their near all-time highs? We think the answers to both are yes. What if they are wrong? If we do not get a recession and CPI doesn’t get to 2% but remains in the 3-4% area, we should assume that the Fed will keep rates higher for longer (as many governors are trying to convince the markets recently). If so, we may see a backup in Treasury rates, although probably not back to the recent highs, and also an equity market correction, but not likely retesting the lows. We expect high yield would tread water.
There is always money to be made trading short-term swings in the market. In the 4th quarter, returns compared very favorably to those of the prior three quarters combined. For high yield, year-to-date returns through September 30th were 5.96%. The fourth quarter returns were 7.06%. For the S&P 500 the returns for the same periods were 13.07% and 11.69%, respectively. Interestingly, for the Equal Weighted S&P 500, an index we feel better reflects active management portfolio construction, the returns were 1.79% in the nine-month period and a stunning 11.87% in the 4th quarter! For the U.S. Treasury market, year-to-date through Q3 and Q4, returns were negative 1.76% and positive 5.72%, respectively. Too much too fast? One consequence of this large move in the Treasury market has been to ease financial conditions. According to the Goldman Sachs’ Financial Conditions Index, conditions have eased more in the past two months than they have in similar periods over the past 40 years.
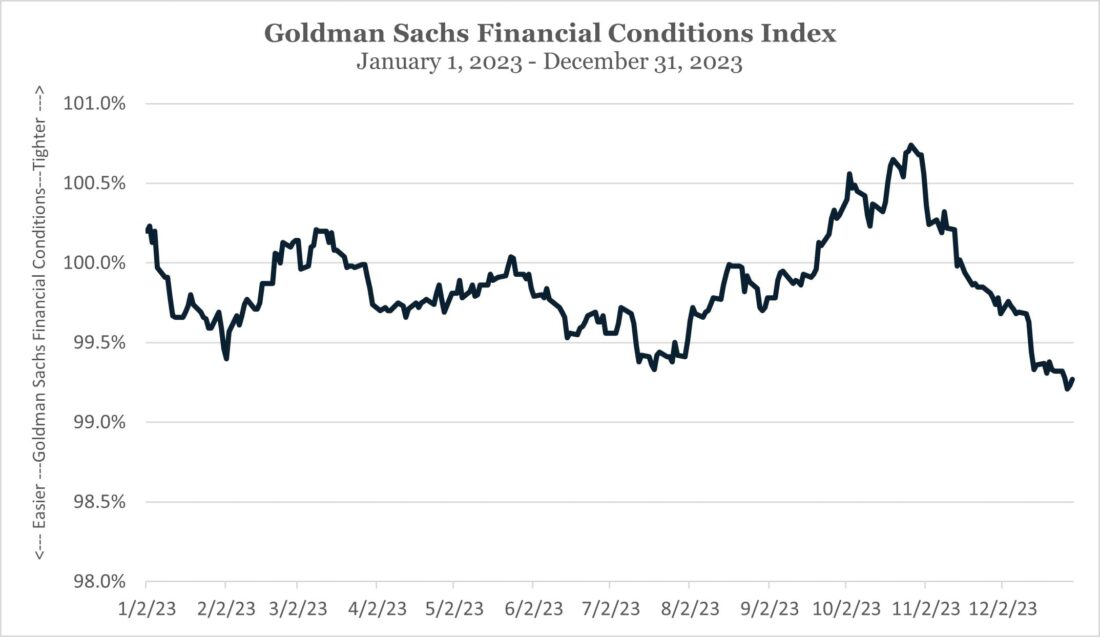
Data Source: Bloomberg
Jim Bianco believes “this will provide a tailwind for the economy and gives ‘sticky’ inflation support in 2024.” For reference, the Atlanta Fed Sticky CPI gauge was still 4.75% at the end of November, down from a peak of 6.73% at year-end 2022.
How should fixed income investors best position themselves now given the uncertainty regarding interest rates and economic growth, especially given the big rally in the fourth quarter? Sensitivity to interest rates (i.e., interest duration) cuts both ways. Clearly it helped in late 2023. There is, however, a second factor for investors in corporate debt that gets less attention, and that is spread duration, or the sensitivity to changes in spreads over U.S. Treasuries. A bond’s spread is the compensation investors receive for the risk they take when they purchase corporate credit. As you would expect, spreads tend to move up (widen) and down (tighten) depending on the perceived future health of the economy, which generally impacts corporate profits and in turn dictates companies’ ability to manage their debt loads. Spread duration indicates how much a bond changes in value based on changes in spread.
It is especially useful to evaluate spread duration relative to yield, as the relationship provides a sense of how much cushion exists in the market. Comparing the ratio of yields to spread duration across maturities provides a more accurate picture than spread duration alone, because the two metrics are linked – a high yielding bond with high spread duration would be less impacted by a change in spreads than a lower yielding bond with the same duration. Here is a table looking at various maturity bands in the high yield market comparing spread duration against both yields to maturity and current yields:
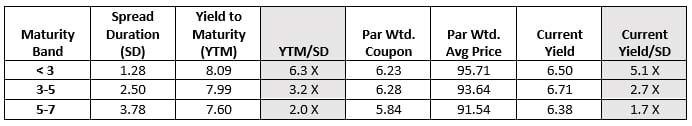
Data is as of 12/31/23. The < 3 year band is the ICE BofA 0-3 Year US HY Index. The 3-5 year band is the ICE BofA 3-5 Year US Cash Pay HY Index. The 5-7 year band is the ICE BofA 5-7 Year US Cash Pay HY Index. Current yield represents Coupon/Price. Data Source: Bloomberg
The highlighted columns show the multiples of both the yield to maturity and the current yield divided by the spread duration. The higher the multiple, the less impact spread changes have on the value of a bond (even if the actual spread duration is bigger). As you can see, the ratio greatly favors the shortest band, below 3 years to maturity. This is partially the result of the inverted yield curve, which means that the shorter cohorts actually have higher yields, combined with lower duration, which makes them very attractive in our view.
Interestingly, the absolute yield to maturity is also highest in the shortest cohort. Again, this is partly due to the continued inversion of the yield curve, but also because benchmark strategies, which typically match the market’s overall duration (i.e., predominantly longer-dated bonds), tend to bid these benchmark issues up, thereby lowering the yield on them. These yield-insensitive buyers can occasionally cause yields on longer dated paper to be a bit lower than we feel they should be. Our philosophy has always been to identify the most attractive parts of the market and to find the most advantageous way to invest in them; this validates our shortening of duration to get both better yield and a greater measure of protection from spread volatility.
In sum, the “everything rally” in the fourth quarter mostly reversed the declines of 2022 for the S&P 500, S&P 500 equal weight, and high yield, but not for investment grade bonds. The two-year un-annualized returns for those sectors respectively are: +3.42%, +0.84%, and +0.73% versus –8.20%. Unless we get meaningful cuts to interest rates in 2024, it is unlikely that investment grade will outperform generally from here, so we are sticking with our positioning in shorter-dated, mostly non-investment grade bonds with ample cash and equivalents, which will allow us to take advantage of opportunities resulting from periods of future market volatility.
Thank you for your continued support, and here is wishing for good times ahead.
—
Originally Published January 16, 2024 – Where Are We Going?
Past performance does not guarantee future results. This commentary contains the current opinions of the authors as of the date above which are subject to change at any time. This commentary has been distributed for informational purposes only and is not a recommendation or offer of any particular security, strategy or investment product. Information contained herein has been obtained from sources believed to be reliable, but is not guaranteed.
No part of this article may be reproduced in any form, or referred to in any other publication, without the express written permission of Osterweis Capital Management.
Current and future holdings are subject to risk.
A basis point is a unit that is equal to 1/100th of 1%.
Yield is the income return on an investment, such as the interest or dividends received from holding a particular security. A yield curve is a graph that plots bond yields vs. maturities, at a set point in time, assuming the bonds have equal credit quality. In the U.S., the yield curve generally refers to that of Treasuries.
Spread is the difference in yield between a risk-free asset such as a Treasury bond and another security with the same maturity but of lesser quality.
The S&P 500 Index is an unmanaged index that is widely regarded as the standard for measuring large-cap U.S. stock market performance.
The S&P 500 Equal Weight Index is the equal-weight version of the S&P 500 Index. The index includes the same constituents as the capitalization-weighted S&P 500, but each company in the S&P 500 Equal Weight Index is allocated a fixed weight – or 0.2% of the index total at each quarterly rebalance.
The ICE BofA U.S. High Yield Index tracks the performance of U.S. dollar denominated below-investment grade corporate debt publicly issued in the U.S. domestic market.
The ICE BofA 0-3 Year U.S. High Yield Index is the 0-3 year segment of the ICE BofA U.S. High Yield Index.
The ICE BofA U.S. Cash Pay High Yield Index tracks the performance of U.S. dollar denominated below investment grade corporate debt, currently in a coupon paying period, that is publicly issued in the U.S. domestic market.
The ICE BofA 3-5 Year U.S. Cash Pay High Yield Index is the 3-5 year segment of the ICE BofA U.S. Cash Pay High Yield Index.
The ICE BofA 5-7 Year U.S. Cash Pay High Yield Index is the 3-5 year segment of the ICE BofA U.S. Cash Pay High Yield Index.
The Bloomberg U.S. Aggregate Bond Index (Agg) is widely regarded as a standard for measuring U.S. investment grade bond market performance.
Source for any Bloomberg index is Bloomberg Index Services Limited. BLOOMBERG® is a trademark and service mark of Bloomberg Finance L.P. and its affiliates (collectively “Bloomberg”). Bloomberg owns all proprietary rights in the Bloomberg Indices. Bloomberg does not approve or endorse this material, or guarantees the accuracy or completeness of any information herein, or makes any warranty, express or implied, as to the results to be obtained therefrom and, to the maximum extent allowed by law, neither shall have any liability or responsibility for injury or damages arising in connection therewith.
Effective 6/30/22, the ICE indices reflect transactions costs. Any ICE index data referenced herein is the property of ICE Data Indices, LLC, its affiliates (“ICE Data”) and/or its Third Party Suppliers and has been licensed for use by OCM. ICE Data and its Third Party Suppliers accept no liability in connection with its use. See https://www.osterweis.com/glossary for a full copy of the Disclaimer.
The Goldman Sachs Financial Conditions Index is defined as a weighted average of riskless interest rates, the exchange rate, equity valuations, and credit spreads, with weights that correspond to the direct impact of each variable on GDP.
The fed funds rate is the rate at which depository institutions (banks) lend their reserve balances to other banks on an overnight basis.
The Consumer Price Index (CPI) is a measure of the average change over time in the prices paid by urban consumers for a market basket of consumer goods and services. There is typically a one-month lag in the measure due to the release schedule from the U.S. Bureau of Labor Statistics.
The Core Consumer Price Index is the same as regular CPI, excluding the prices of food and energy.
The Sticky Price Index sorts the components of the consumer price index (CPI) into either flexible or sticky (slow to change) categories based on the frequency of their price adjustment.
Gross Domestic Product (GDP) is the monetary value of all the finished goods and services produced within a country’s borders in a specific time period.
Par weighted average price is computed by weighting the price of each bond by its relative position size (face value) in the portfolio.
Par weighted average coupon is computed by weighting the coupon of each bond by its relative position size (face value) in the portfolio.
Osterweis Capital Management is the adviser to the Osterweis Funds, which are distributed by Quasar Distributors, LLC. [OCMI-477930-2024-01-09]
Disclosure: Interactive Brokers
Information posted on IBKR Campus that is provided by third-parties does NOT constitute a recommendation that you should contract for the services of that third party. Third-party participants who contribute to IBKR Campus are independent of Interactive Brokers and Interactive Brokers does not make any representations or warranties concerning the services offered, their past or future performance, or the accuracy of the information provided by the third party. Past performance is no guarantee of future results.
This material is from Osterweis Capital Management and is being posted with its permission. The views expressed in this material are solely those of the author and/or Osterweis Capital Management and Interactive Brokers is not endorsing or recommending any investment or trading discussed in the material. This material is not and should not be construed as an offer to buy or sell any security. It should not be construed as research or investment advice or a recommendation to buy, sell or hold any security or commodity. This material does not and is not intended to take into account the particular financial conditions, investment objectives or requirements of individual customers. Before acting on this material, you should consider whether it is suitable for your particular circumstances and, as necessary, seek professional advice.
