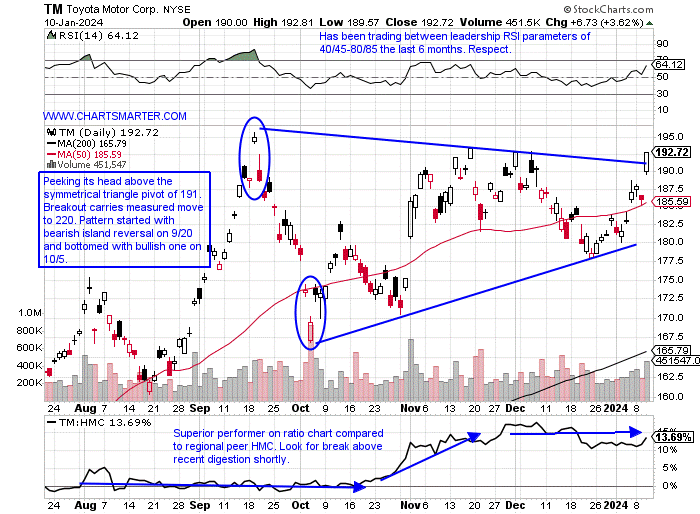
Foreign Auto Bar Bell Approach:
When comparing the two Japanese auto giants there really is not one. We touched on this yesterday in our Consumer Note and this name is sitting just 1% off most recent 52-week highs, while HMC is now 13% off its annual peak. The daily chart of Toyota below speaks for itself, but it is a good sign that its WEEKLY chart is setting up too with a long cup with handle base (195.75 pivot) in a pattern now 2 years in duration. When one compares that to the WEEKLY chart of HMC, it is easy to spot where the troubles began with the bearish evening star pattern completed the week ending 9/29 that slumped 4.5% (notice the gravestone doji candle the week immediately prior). Give it credit as it looks for a 4-week win streak this Friday and could be ready to record a bullish MACD WEEKLY crossover which it has not done since November 2022. Both of these names can be considered among the better of the automobile plays and each pays a dividend yield in the 3% range.
—
Originally Posted January 10, 2024
Disclosure: ChartSmarter
The opinions expressed by the author are his own. Trades or positions discussed by the author are neither a solicitation to buy or sell a security, nor are they investment advice. Recipients should always do their own due diligence before buying or selling a security. Every reader is responsible for his/her decision to buy or sell a security.
Disclosure: Interactive Brokers
Information posted on IBKR Campus that is provided by third-parties does NOT constitute a recommendation that you should contract for the services of that third party. Third-party participants who contribute to IBKR Campus are independent of Interactive Brokers and Interactive Brokers does not make any representations or warranties concerning the services offered, their past or future performance, or the accuracy of the information provided by the third party. Past performance is no guarantee of future results.
This material is from ChartSmarter and is being posted with its permission. The views expressed in this material are solely those of the author and/or ChartSmarter and Interactive Brokers is not endorsing or recommending any investment or trading discussed in the material. This material is not and should not be construed as an offer to buy or sell any security. It should not be construed as research or investment advice or a recommendation to buy, sell or hold any security or commodity. This material does not and is not intended to take into account the particular financial conditions, investment objectives or requirements of individual customers. Before acting on this material, you should consider whether it is suitable for your particular circumstances and, as necessary, seek professional advice.
