From SIA Charts
Investopedia is partnering with CMT Association on this newsletter. The contents of this newsletter are for informational and educational purposes only, however, and do not constitute investing advice. The guest authors, which may sell research to investors, and may trade or hold positions in securities mentioned herein do not represent the views of CMT Association or Investopedia. Please consult a financial advisor for investment recommendations and services.
1/
Lululemon Athletica Inc
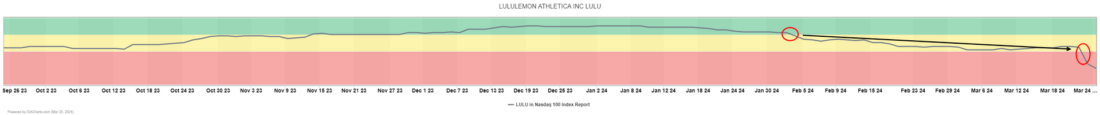
At SIACharts, we compare head-to-head battles of thousands of stocks, commodities, mutual funds and exchange traded funds daily and rank them by who is winning the most in their respective universes. The top 25% are considered the Green Favored Zone, 26-50% make up the Yellow Neutral Zone and the bottom half of each league table is considered the Red Unfavored Zone. SIA Charts relative strength reports also provides investors with an indication of changing and ongoing trends in a stock’s performance relative to its peers.
SIA Charts’ relative strength rankings help investors manage risk by identifying stocks and sectors which are underperforming relative to their peers and/or their benchmarks and should potentially be avoided. Staying away from stocks that are not attracting capital can help investors to avoid areas at higher risk of absolute declines and relative underperformance and to reduce negative event risk.
Lululemon athletica (LULU) reported earnings after the close last Thursday and then plunged 15.8% last Friday. Relative strength analysis had provided indications that the stock was vulnerable heading into the earnings report. LULU dropped out of the green zone into the yellow zone of the SIA NASDAQ 100 Index Report on February 2nd. From then to March 20th, the shares were essentially flat, posting a meager 1.4% gain, while the NASDAQ Composite rose 4.9% over the same period.
Weakening relative strength helped to keep traders from getting sucked in when the stock popped just before the earnings report as well, enabling them to avoid two days of selling pressure which have pushed the shares deep into the Red Unfavored Zone with a drop of 32 positions to 78th place. Trading in lululemon athletica (LULU) shares over the last six months shows how significant breakouts and breakdowns often mirror each other. Back in October, the shares gapped up and broke out to the upside on a spike in volume signaling increased accumulation and the start of a new uptrend. Last week, calling off a false breakout, the shares gapped down on a spike in volume, signaling increased distribution and the start of a new downtrend.
2/
Candlestick Chart
Next potential downside support appears at previous lows at $355.00, followed by $325.00 and $310.00 tests on trend. Initial resistance appears between the $400.00 round number and the bottom of Friday’s gap near $415.00.
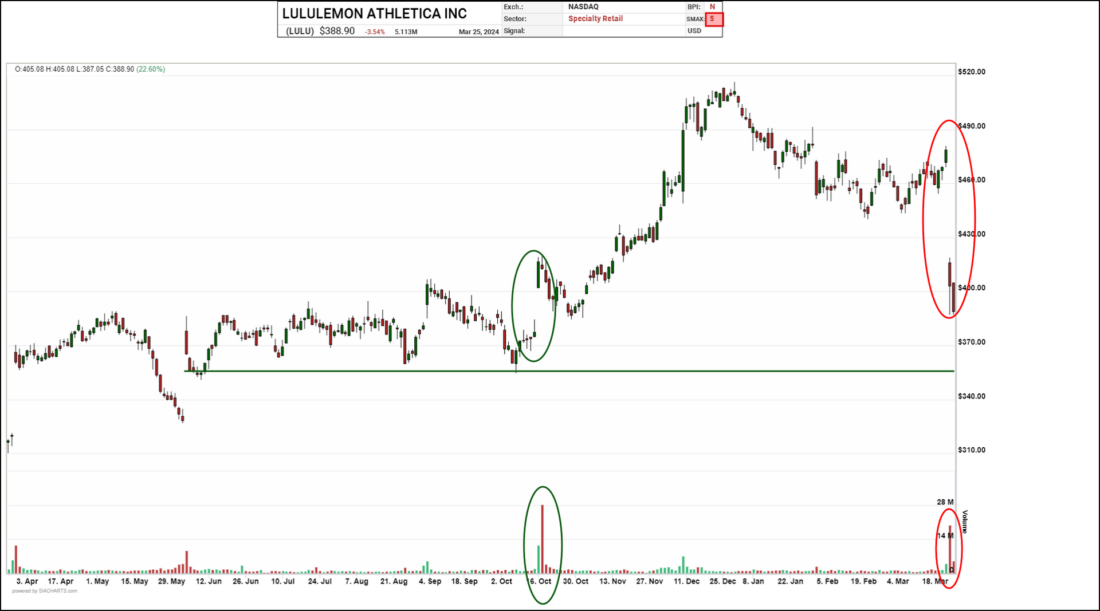
A major breakdown is underway in lululemon athletica (LULU) shares. LULU peaked back in January and spent the winter trending downward, Earlier this month, the shares bounced up off of support near $440.00 and even staged a double top breakout. Friday’s selloff called off the false breakout, took out $440.00 and completed a bearish Spread Double Bottom pattern, signaling the start of a new downleg that has already carried the shares back under $400.00.
3/
Point and Figure Chart
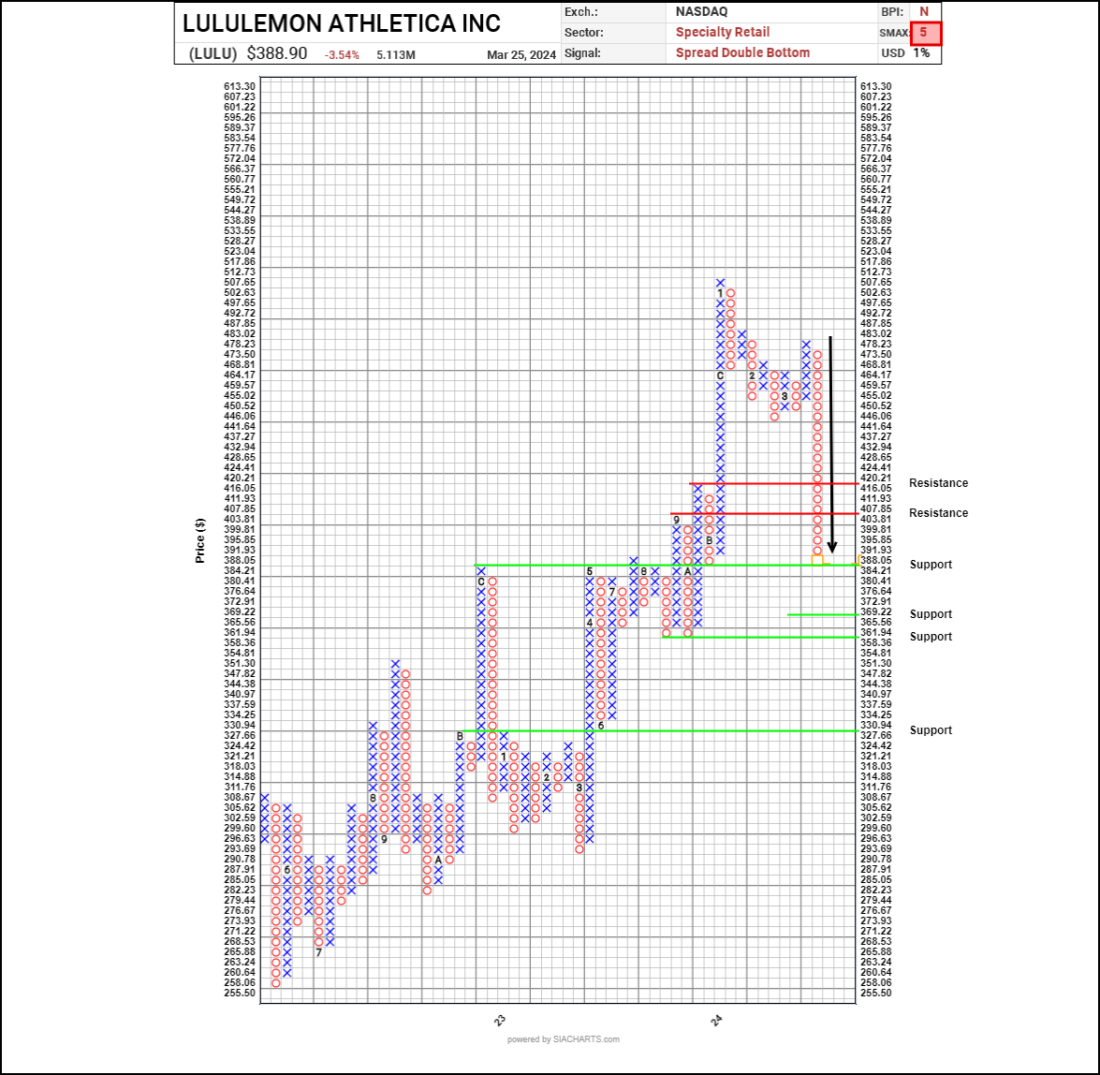
Previous column highs and lows suggest potential support may emerge near $384.20, then the $358.35-$365.55 zone and near $327.65. Initial resistance on a bounce appears near the $400.00 round number, then $407.85 based on a 3-box reversal.
With a bearish SMAX score (which is a near-term 1 to 90-day indicator comparing an asset against different equal-weight asset classes) of 5 out of 10, LULU is exhibiting short-term weakness against the asset classes.
—-
Originally posted on 28 March, 2024
Disclosure: Investopedia
Investopedia.com: The comments, opinions and analyses expressed herein are for informational purposes only and should not be considered individual investment advice or recommendations to invest in any security or to adopt any investment strategy. While we believe the information provided herein is reliable, we do not warrant its accuracy or completeness. The views and strategies described on our content may not be suitable for all investors. Because market and economic conditions are subject to rapid change, all comments, opinions and analyses contained within our content are rendered as of the date of the posting and may change without notice. The material is not intended as a complete analysis of every material fact regarding any country, region, market, industry, investment or strategy. This information is intended for US residents only.
Disclosure: Interactive Brokers
Information posted on IBKR Campus that is provided by third-parties does NOT constitute a recommendation that you should contract for the services of that third party. Third-party participants who contribute to IBKR Campus are independent of Interactive Brokers and Interactive Brokers does not make any representations or warranties concerning the services offered, their past or future performance, or the accuracy of the information provided by the third party. Past performance is no guarantee of future results.
This material is from Investopedia and is being posted with its permission. The views expressed in this material are solely those of the author and/or Investopedia and Interactive Brokers is not endorsing or recommending any investment or trading discussed in the material. This material is not and should not be construed as an offer to buy or sell any security. It should not be construed as research or investment advice or a recommendation to buy, sell or hold any security or commodity. This material does not and is not intended to take into account the particular financial conditions, investment objectives or requirements of individual customers. Before acting on this material, you should consider whether it is suitable for your particular circumstances and, as necessary, seek professional advice.
