At a cursory look at premium electric vehicle manufacturer Lucid Group (NASDAQ:LCID), it’s easy to become discouraged. Over the past 52 weeks, its equity shares suffered a devastating loss of more than 72%. Fundamentally, the EV price war that Tesla (NASDAQ:TSLA) initiated has come back to bite it in the hind end. Lucid was no beneficiary. Still, intriguing price discovery dynamics suggest a compelling take regarding the LCID stock forecast.
Essentially, when Lucid went public (via a reverse merger with a blank-check firm) in 2021, a proper LCID stock forecast was difficult to ascertain. Back then, the price discovery mechanism saw significant movement. A year later, circumstances calmed down. However, broader economic woes meant that the weak hands panicked out.
However, the paradigm shifted last year. Specifically, the range of price discovery became concentrated, implying that fewer newsworthy events moved Lucid’s share price. Stated differently, the folks remaining in the market were the committed strong hands. Therefore, it may be ill-advised for the bears to attack the EV manufacturer.
Given the math underlining the current LCID stock forecast, I am bullish on Lucid as a speculative trading opportunity.
Establishing a Framework for an LCID Stock Forecast

Look at most stock price charts and you’ll find that price is represented as a function of time. In mathematical terms, time is the independent variable and price is the dependent variable. In other words, we’re seeing how the passage of time results in changes to the price. However, in some ways, time is a waste of an axis because the earth moves around the sun regardless of what happens on Wall Street.
To gauge market sentiment – and thus extract a more accurate LCID stock forecast – I decided to represent LCID’s share price as a function of its “mobility” or its rate of change over the defined time basis (in my case, weekly average closing price). Under this framework, we’re exploring the security in its relationship to its derivative (rate of change).
To better explain, I’d like to explore how much “energy” expenditure is involved in moving LCID from one year to the next. What I discovered was quite fascinating and may have serious implications for approaching Lucid shares.
The Bullish Case: LCID to $6.63
Performing the aforementioned exercise of extracting an LCID stock forecast by viewing price as a function of its mobility, we come across three distinct sentiment frameworks:
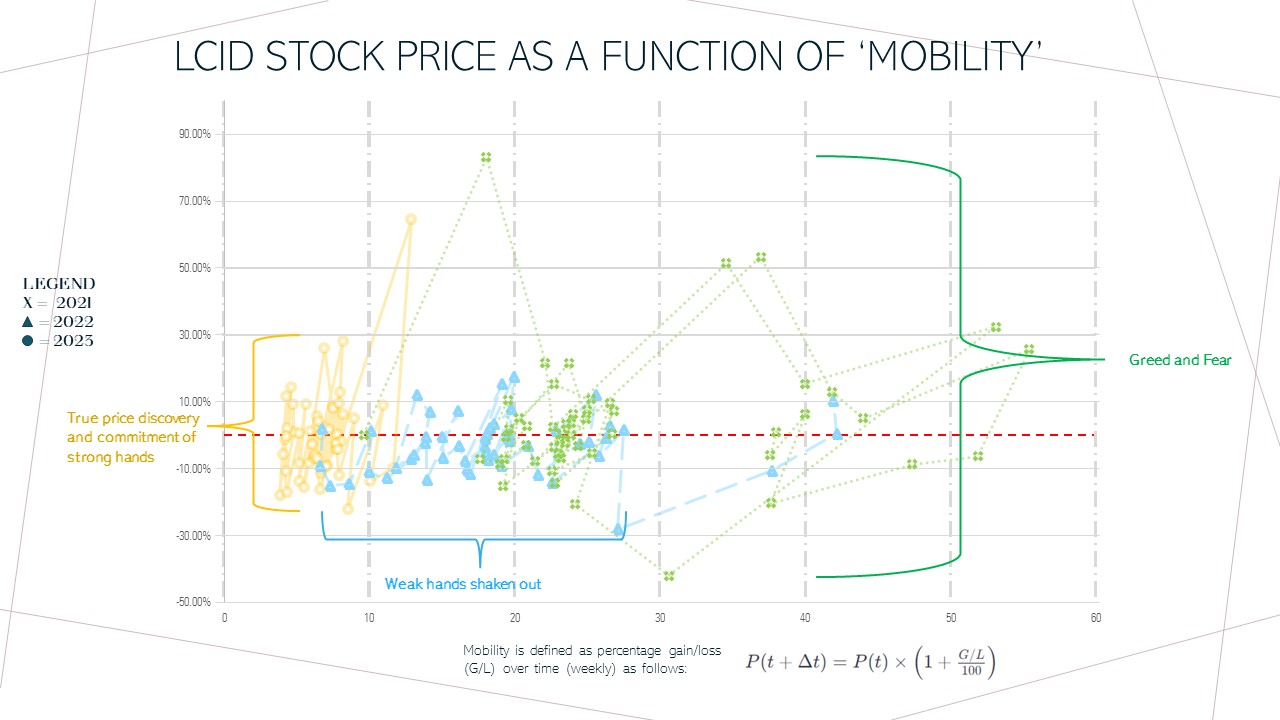
- In 2021, the year Lucid went public, LCID saw a significant magnitude of fear and greed. Price discovery occurred across a vast price range.
- In 2022, price discovery narrowed significantly in range, with most of the price action occurring within $10 to $20. However, the discovery process was quite robust.
- In 2023, the price discovery became much more concentrated within a narrow price range. While some outlier movements materialized, it’s plausible that this narrowing stems from the commitment of the strong hands of the market.
In summary, Lucid transitioned from extreme greed and fear to a baseline in which only high-commitment investors are involved.
Given the assumption that only the strong hands remain, the median price of Lucid in 2023 is arguably a realistic basis for an LCID stock forecast. That number comes out to $6.63.
Now, it’s interesting that analysts rate Lucid a consensus hold with an average price target of $5.14. However, the high-side target lands at $7, courtesy of Bank of America Securities’ John Murphy. That’s pretty close to the mathematically extracted LCID stock forecast of $6.63.
The Bearish Case: LCID to $1

Of course, given the volatility of Lucid’s market performance, one can’t just leave an LCID stock forecast without discussing the risks. For that, I’m going to turn to CFRA analyst Garrett Nelson, who rates shares a “sell” with a $1 price target. That implies a downside risk of about 70%.
Could that happen? Fundamentally, yes. Obviously, Tesla’s price war caused so much pain to the industry. And while it may be poetic justice that the house that Elon Musk built is getting a taste of its own medicine, no (western) pure-play EV manufacturer appears to have benefitted from the firestorm.
Also, Lucid suffers from high short interest of 28.96% of its float. As well, large (possibly institutional) traders are betting against LCID with short call positions. As a result, the market maker’s gamma exposure to LCID options comes in at $70,000 per every 1% move in the underlying security. That gives you an indication that both in the open and options markets, traders are bearish on LCID.
However, given this stacked exposure to one side of the trade, it may not take much to panic out the bears.
Bottom Line: The Math Favors the Optimistic Speculator

Ordinarily, high short interest in the open market and bearish positions taken in the derivatives market warrants caution. There’s a reason why bears believe greater profitability potential exists in betting against the underlying security than betting with it. However, the pessimists in this case may have bitten off more than they can chew.
Primarily, the math appears to favor the optimists because LCID’s price discovery is now concentrated largely on its top believers. With few weak hands available, that’s likely going to make the bears job of finding shares to short more difficult. And it could also make any potential short-covering activities all the more sweeter for the bulls. Therefore, the LCID stock forecast of $6.63 appears credible.
On the date of publication, Josh Enomoto did not have (either directly or indirectly) any positions in the securities mentioned in this article. The opinions expressed in this article are those of the writer, subject to the InvestorPlace.com Publishing Guidelines.
