By Ryan Gorman, CFA, CMT, BFA
1/ The Big Picture
2/ Digging into the S&P 500
3/ Large Cap
4/ Mid Cap
5/ Small Cap
Investopedia is partnering with CMT Association on this newsletter. The contents of this newsletter are for informational and educational purposes only, however, and do not constitute investing advice. The guest authors, which may sell research to investors, and may trade or hold positions in securities mentioned herein do not represent the views of CMT Association or Investopedia. Please consult a financial advisor for investment recommendations and services.
1/ The Big Picture
Over the weekends, I try to take a top-down look and drill into many charts. The focus is on what is in favor now. Other authors over the last few months have highlighted the relative rotation graph tool. This is a great way to look at momentum trends to see what sectors are in favor. This can often tell a lot about where in the market cycle we are.
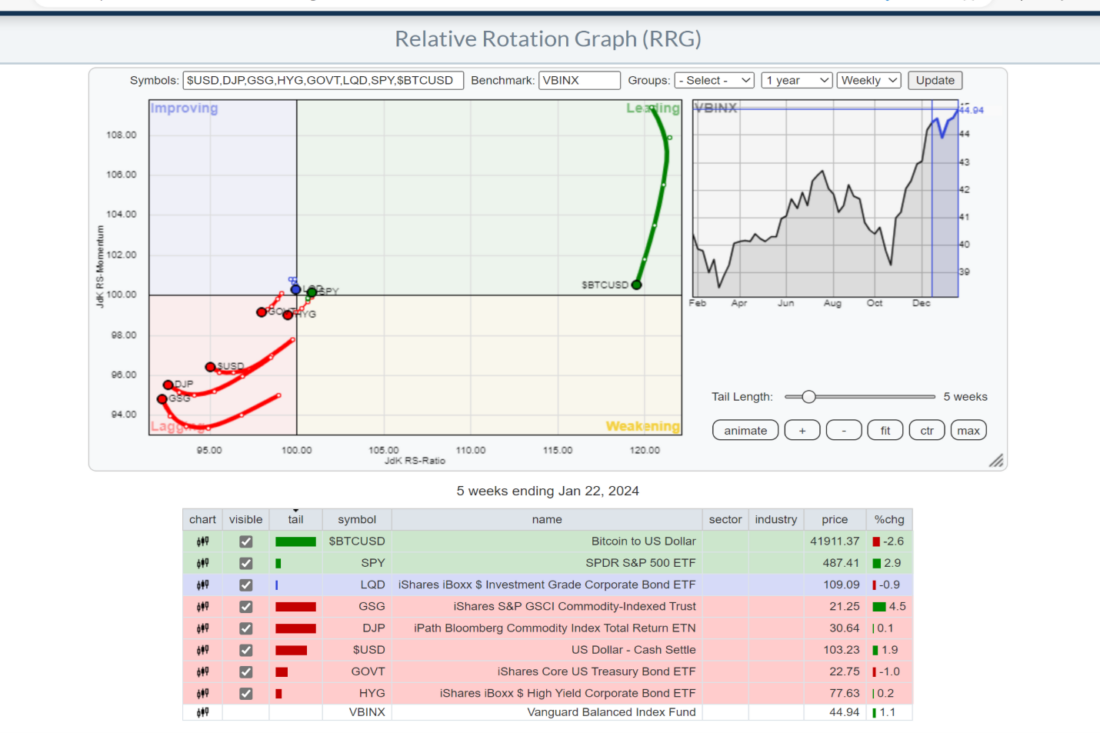
Here, we see that Stocks as measured by the S&P 500 have turned back up into the leading quadrant. This can happen, while there is often a movement clockwise into the quadrants like a changing of the seasons, there are other times where the course changes. As Stocks are moving, we will drill down further here.
Interestingly, various commodity indices are rounding out and heading into the improving quadrant. They are also taking a wide circle which can often indicate a persistent trend. This will be worth following for clues about inflation.
2/ Digging into the S&P 500
The next weekend/Monday drill down is into the sectors of the S&P 500.
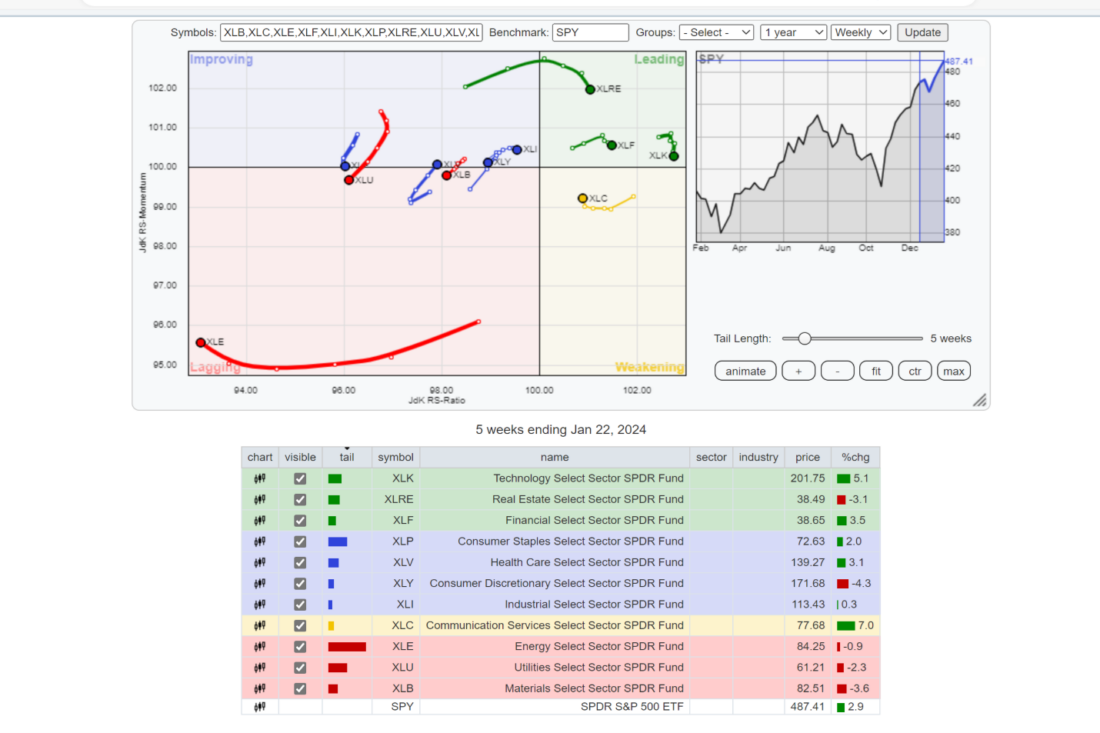
Here we see that the leaders are Real Estate, Financials, and Tech. These are considered risk on sectors and have a fair amount of interest rate sensitivity. As rates have fallen on the hopes that the Federal Reserve begins cutting interest rates, it makes sense economically that these sectors have led.
Utilities and soon Consumer Staples have turned back down into the lagging quadrant, these are deemed risk off or more defensive sectors. This shows that market participants to looking for more aggressive positioning for now.
3/ Large Cap
Each week I like to look for stocks with positive 20-week momentum. This can help identify trends. I had 16 stocks come through the screen based on my criteria from the S&P 500. One that is from the financial sector, which we saw above is a leader and is recently breaking out if COF.
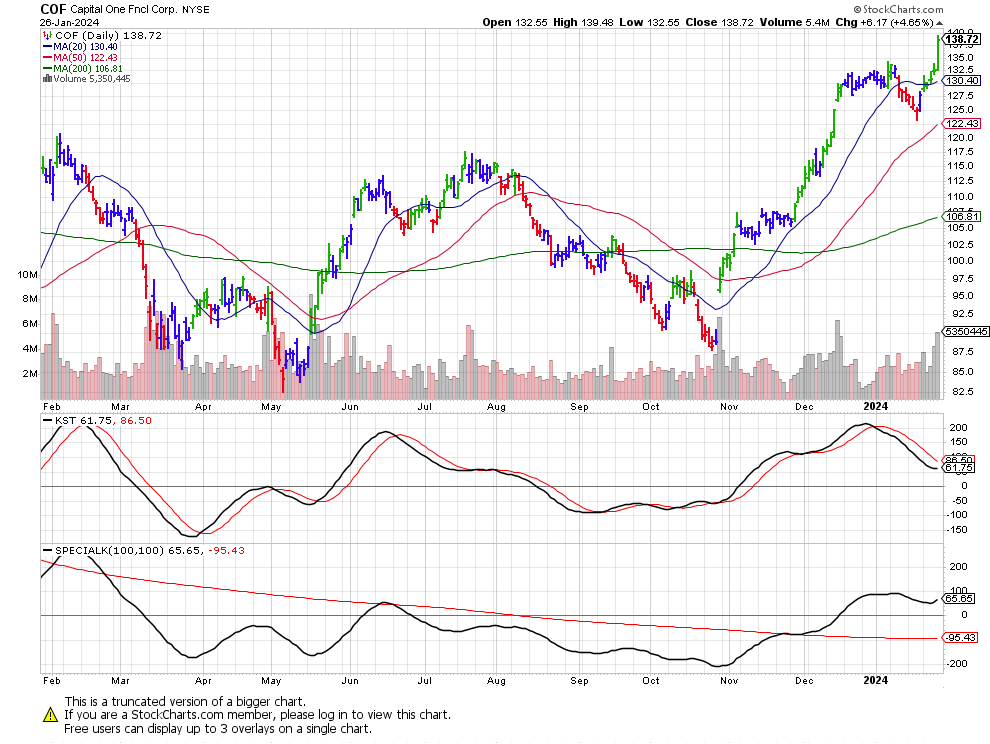
As we can see, the 20-day moving average is above the 50-day, which is in turn above the 200-day. This shows a persistent uptrend. For looking day to day, you may notice my bar chart is multi -color, I like to use the Elder Impulse system. This helps me identify quickly stocks that are in gear, you can read more about this tool here: https://school.stockcharts.com/doku.php?id=chart_analysis:elder_impulse_system
In addition to having a green elder impulse bar and just recently breaking to new highs, the Pring KST is just turning up as well. This can indicate a move is beginning and we are not jumping on the trend too late. Know Sure Thing (KST) [ChartSchool] (stockcharts.com)
4/ Mid Cap
I look at each of the major indices to find ideas by market cap. Smaller companies are often deemed more volatile and aggressive but may present larger opportunity. Looking at the S&P 400 midcap index, there were 15 meeting my criteria.
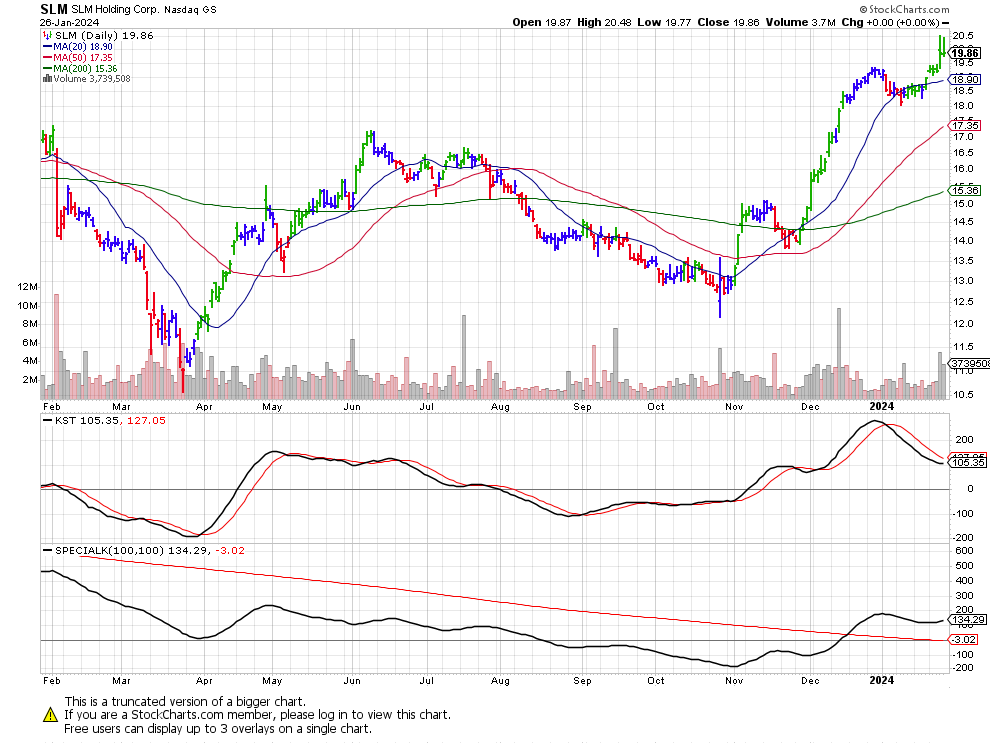
SLM is a consumer finance stock, in one of the sectors we have seen as a leader. Though the last two days reversed and could show a false breakout, we are still above the breakout line. Further the Elder impulse bar is still green and the KST is moving up.
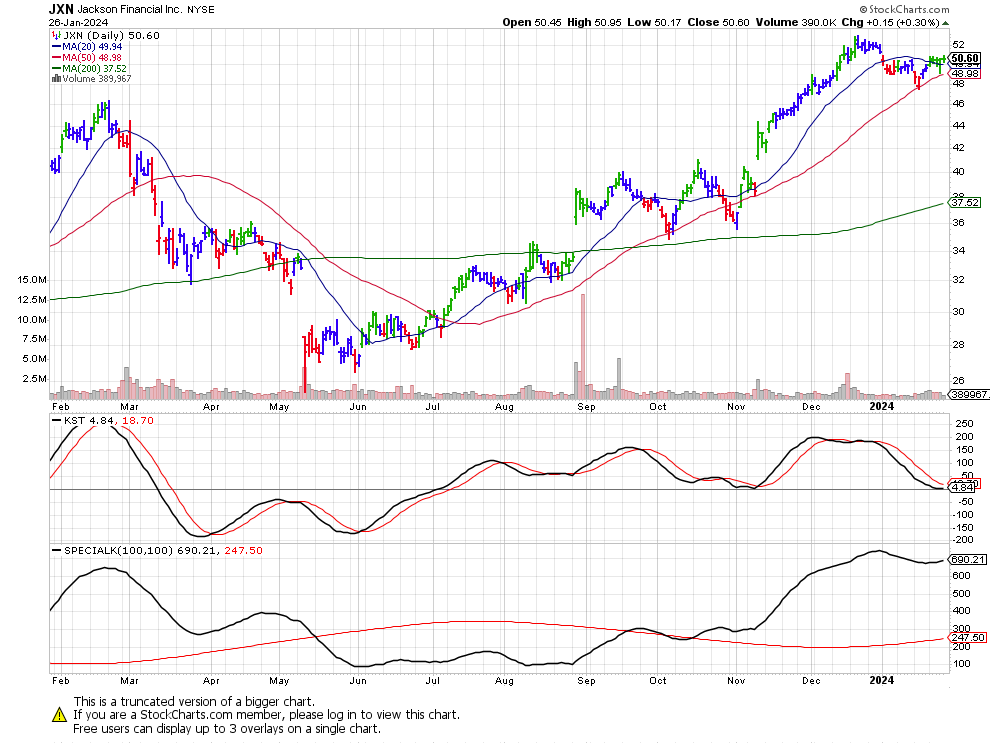
5/ Small Cap
Finally, let us look at the S&P 600 small cap index, 25 stocks showed up in this screen.
Another financial JXN has not fully broken out but the 20- and 50-day moving average are close together providing potential support. Elder bar is green and KST is turning up.
—
Originally posted 29th January 2024
Disclosure: Investopedia
Investopedia.com: The comments, opinions and analyses expressed herein are for informational purposes only and should not be considered individual investment advice or recommendations to invest in any security or to adopt any investment strategy. While we believe the information provided herein is reliable, we do not warrant its accuracy or completeness. The views and strategies described on our content may not be suitable for all investors. Because market and economic conditions are subject to rapid change, all comments, opinions and analyses contained within our content are rendered as of the date of the posting and may change without notice. The material is not intended as a complete analysis of every material fact regarding any country, region, market, industry, investment or strategy. This information is intended for US residents only.
Disclosure: Interactive Brokers
Information posted on IBKR Campus that is provided by third-parties does NOT constitute a recommendation that you should contract for the services of that third party. Third-party participants who contribute to IBKR Campus are independent of Interactive Brokers and Interactive Brokers does not make any representations or warranties concerning the services offered, their past or future performance, or the accuracy of the information provided by the third party. Past performance is no guarantee of future results.
This material is from Investopedia and is being posted with its permission. The views expressed in this material are solely those of the author and/or Investopedia and Interactive Brokers is not endorsing or recommending any investment or trading discussed in the material. This material is not and should not be construed as an offer to buy or sell any security. It should not be construed as research or investment advice or a recommendation to buy, sell or hold any security or commodity. This material does not and is not intended to take into account the particular financial conditions, investment objectives or requirements of individual customers. Before acting on this material, you should consider whether it is suitable for your particular circumstances and, as necessary, seek professional advice.
Disclosure: ETFs
Any discussion or mention of an ETF is not to be construed as recommendation, promotion or solicitation. All investors should review and consider associated investment risks, charges and expenses of the investment company or fund prior to investing. Before acting on this material, you should consider whether it is suitable for your particular circumstances and, as necessary, seek professional advice.
