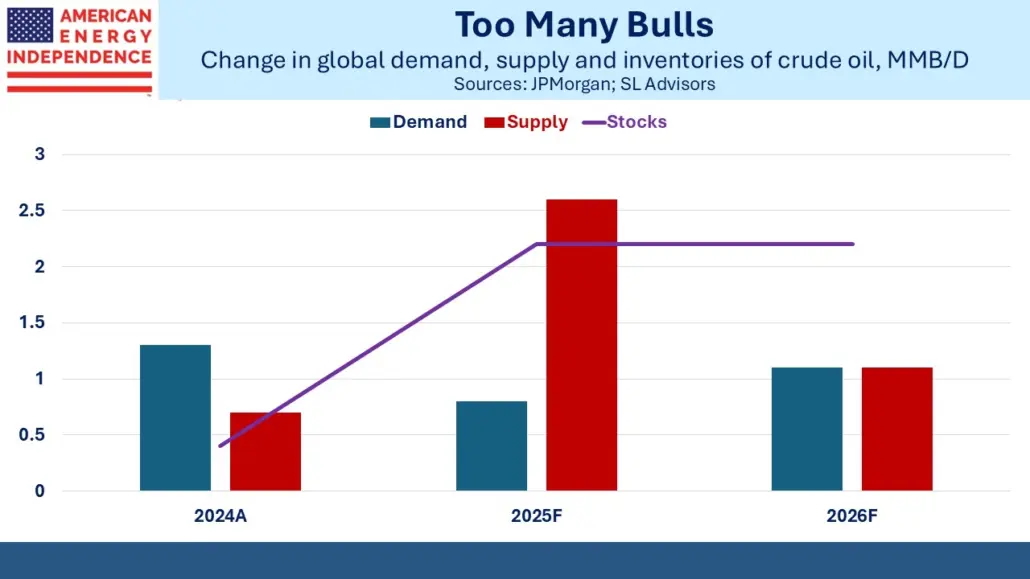
Supplies of crude oil were already set to increase by 2.6 Million Barrels per day (MMB/D) year-on-year before the OPEC+ announcement on Monday. Demand is growing in emerging economies across Asia, Africa and South America, but not fast enough. This has led to forecasts of stocks increasing by 2 MMB/D this year.
Last year we noted that the International Energy Agency (IEA) was consistently promoting a politically motivated outlook for global energy based on strong growth in renewables (see Serious Energy Forecasts Are Rare). They expect an 8 MMB/D imbalance between supply and demand in 2030.
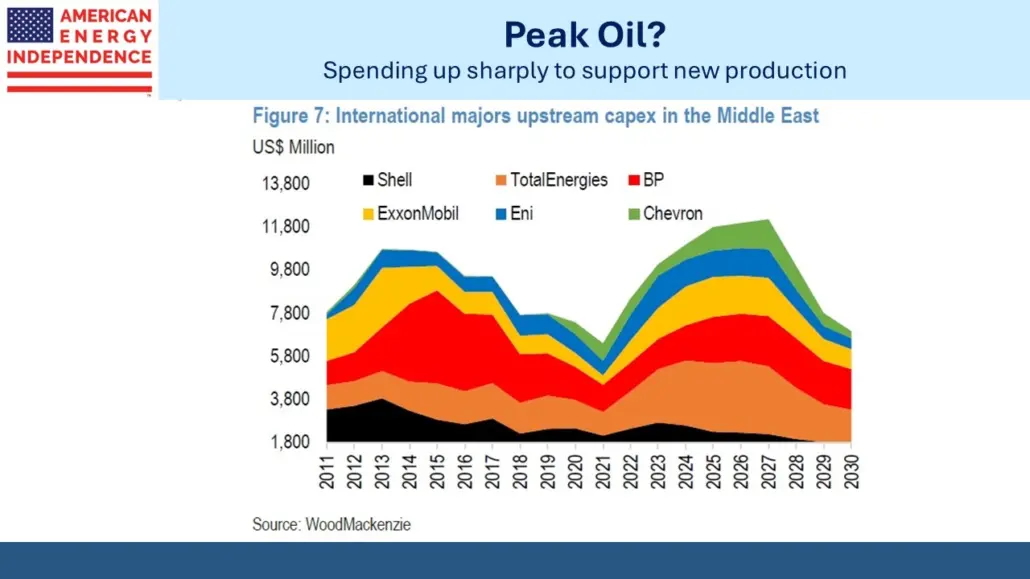
Meanwhile the world’s producers of oil expect the opposite and have been increasing output. Spending by international majors on upstream capex in the Middle East this year is likely to be double the low hit during the pandemic, led by TotalEnergies and Exxon. The UAE will add 0.4 MMB/D of capacity over the next couple of years and Iraq 0.3 MMB/D.
North American output is also increasing, with US production forecast to rise around 0.3 MMB/D and Canada by 0.2 MMB/D. However, the enthusiasm with which energy executives received Trump’s win in November is moderating with lower prices, and forecasts of US output will likely be trimmed. In a sign E&P companies are becoming more cautious about capital allocation, Chevron cut 2Q25 stock buybacks by around a third versus the previous quarter. Shale operator Diamondback Energy just cut their output forecast.
Drill baby, drill isn’t resonating. Lower prices are needed to bring the market back into balance, and this will further stimulate demand.
The contrast between the oil and gas business is striking. Because crude oil is a global market, its price reflects energy sentiment around the world. Oil is relatively easy to transport and the cost of doing so is a small percentage of the value of the commodity.
Natural gas moves through pipelines or on an LNG tanker if going overseas. The combined cost of liquefaction and transport can exceed the cost of the gas, which is why it’s around $4 per Million BTUs (MMBTUs) in the US and $11 in Europe. That gas can be shipped to Europe for much less than the $7 difference is driving the sharp rise in US LNG export capacity.
Natural gas trades as regional markets because it’s so difficult to transport. Its price moves rarely reflect any change in sentiment by energy investors. At times crude oil and pipeline stocks have been correlated, although declining company leverage has weakened the relationship. Last year was a good example, with oil down and midstream up strongly. Gas prices rarely share any relationship with pipelines
Natural gas feedstock to LNG terminals is running at 15 Billion Cubic Feet per Day (BCF/D), up from 12.5 BCF/D last year. By 2030 exports will have doubled from 2024.
Australian LNG giant Woodside Energy bought Tellurian last year as it was teetering towards bankruptcy, or “circling the drain” as RBN Energy puts it. Tellurian’s fatal error was to favor contracts that retained price risk. This reflected then-CEO Charif Souki’s long term bullish view on gas prices but impeded financing because of their increased risk profile.
Woodside just announced Final Investment Decision (FID) on the LNG Louisiana terminal, formerly called Driftwood when it was Tellurian’s chief asset. Ironically, they’ve moved ahead with only 1 Million Tons Per Annum (MTPA) of capacity contracted out, from a total of 16.5 MTPA. This is rare because LNG terminals are only good for one thing, so most operators ensure they’ll have enough long-term customers before starting construction.
Woodside believes they’ll negotiate better terms by assuring buyers the LNG really will be delivered. It’s a choice that was never available to Tellurian, whose failure to raise capital and reach FID meant some contracts were later voided. Woodside is a much bigger company but nonetheless S&P changed their credit outlook from stable to negative on the news. They may also calculate that competing projects that have not yet reached FID may now face increased hurdles to line up financing.
The news does assure that gas flows to the Gulf will continue higher.
Tariff uncertainty has caused many companies to suspend earnings guidance for the year, most recently Ford who estimate a $2.5BN impact. Contrast this with Williams Companies, gliding through the market turmoil with equanimity. Much of the gas feeding Gulf coast LNG terminals will pass through their pipeline network. They raised full year guidance by $50MM to $7.7BN.
The energy sector is diverse. Gyrations in crude prices and fears of slower growth are impacting the big integrated oil companies. But the outlook for domestic gas infrastructure remains positive with no visible impact from the macro issues driving equity markets. It’s free of drama from oil prices or tariffs, the calm port in the storm.
—
Originally Posted on May 7, 2025 – Drama-Free Energy Stocks
Important Disclosures
The information provided is for informational purposes only and investors should determine for themselves whether a particular service, security or product is suitable for their investment needs. The information contained herein is not complete, may not be current, is subject to change, and is subject to, and qualified in its entirety by, the more complete disclosures, risk factors and other terms that are contained in the disclosure, prospectus, and offering. Certain information herein has been obtained from third party sources and, although believed to be reliable, has not been independently verified and its accuracy or completeness cannot be guaranteed. No representation is made with respect to the accuracy, completeness or timeliness of this information. Nothing provided on this site constitutes tax advice. Individuals should seek the advice of their own tax advisor for specific information regarding tax consequences of investments. Investments in securities entail risk and are not suitable for all investors. This site is not a recommendation nor an offer to sell (or solicitation of an offer to buy) securities in the United States or in any other jurisdiction.
References to indexes and benchmarks are hypothetical illustrations of aggregate returns and do not reflect the performance of any actual investment. Investors cannot invest in an index and do not reflect the deduction of the advisor’s fees or other trading expenses. There can be no assurance that current investments will be profitable. Actual realized returns will depend on, among other factors, the value of assets and market conditions at the time of disposition, any related transaction costs, and the timing of the purchase. Indexes and benchmarks may not directly correlate or only partially relate to portfolios managed by SL Advisors as they have different underlying investments and may use different strategies or have different objectives than portfolios managed by SL Advisors (e.g. The Alerian index is a group MLP securities in the oil and gas industries. Portfolios may not include the same investments that are included in the Alerian Index. The S & P Index does not directly relate to investment strategies managed by SL Advisers.)
This site may contain forward-looking statements relating to the objectives, opportunities, and the future performance of the U.S. market generally. Forward-looking statements may be identified by the use of such words as; “believe,” “expect,” “anticipate,” “should,” “planned,” “estimated,” “potential” and other similar terms. Examples of forward-looking statements include, but are not limited to, estimates with respect to financial condition, results of operations, and success or lack of success of any particular investment strategy. All are subject to various factors, including, but not limited to general and local economic conditions, changing levels of competition within certain industries and markets, changes in interest rates, changes in legislation or regulation, and other economic, competitive, governmental, regulatory and technological factors affecting a portfolio’s operations that could cause actual results to differ materially from projected results. Such statements are forward-looking in nature and involves a number of known and unknown risks, uncertainties and other factors, and accordingly, actual results may differ materially from those reflected or contemplated in such forward-looking statements. Prospective investors are cautioned not to place undue reliance on any forward-looking statements or examples. None of SL Advisors LLC or any of its affiliates or principals nor any other individual or entity assumes any obligation to update any forward-looking statements as a result of new information, subsequent events or any other circumstances. All statements made herein speak only as of the date that they were made. r
Certain hyperlinks or referenced websites on the Site, if any, are for your convenience and forward you to third parties’ websites, which generally are recognized by their top level domain name. Any descriptions of, references to, or links to other products, publications or services does not constitute an endorsement, authorization, sponsorship by or affiliation with SL Advisors LLC with respect to any linked site or its sponsor, unless expressly stated by SL Advisors LLC. Any such information, products or sites have not necessarily been reviewed by SL Advisors LLC and are provided or maintained by third parties over whom SL Advisors LLC exercise no control. SL Advisors LLC expressly disclaim any responsibility for the content, the accuracy of the information, and/or quality of products or services provided by or advertised on these third-party sites.
All investment strategies have the potential for profit or loss. Different types of investments involve varying degrees of risk, and there can be no assurance that any specific investment will be suitable or profitable for a client’s investment portfolio.
Past performance of the American Energy Independence Index is not indicative of future returns.
Disclosure: SL Advisors
Please go to following link for important legal disclosures: http://sl-advisors.com/legal-disclosure
SL Advisors is invested in all the components of the American Energy Independence Index via the ETF that seeks to track its performance.
Disclosure: Interactive Brokers Third Party
Information posted on IBKR Campus that is provided by third-parties does NOT constitute a recommendation that you should contract for the services of that third party. Third-party participants who contribute to IBKR Campus are independent of Interactive Brokers and Interactive Brokers does not make any representations or warranties concerning the services offered, their past or future performance, or the accuracy of the information provided by the third party. Past performance is no guarantee of future results.
This material is from SL Advisors and is being posted with its permission. The views expressed in this material are solely those of the author and/or SL Advisors and Interactive Brokers is not endorsing or recommending any investment or trading discussed in the material. This material is not and should not be construed as an offer to buy or sell any security. It should not be construed as research or investment advice or a recommendation to buy, sell or hold any security or commodity. This material does not and is not intended to take into account the particular financial conditions, investment objectives or requirements of individual customers. Before acting on this material, you should consider whether it is suitable for your particular circumstances and, as necessary, seek professional advice.
