1/ Dollar Tailwind Ahead for EM Equity?
2/ Watch Out for US Home Construction
3/ Quantum Computing + Momentum
Investopedia is partnering with CMT Association on this newsletter. The contents of this newsletter are for informational and educational purposes only, however, and do not constitute investing advice. The guest authors, which may sell research to investors, and may trade or hold positions in securities mentioned herein do not represent the views of CMT Association or Investopedia. Please consult a financial advisor for investment recommendations and services.
1/
Dollar Tailwind Ahead for EM Equity?
Emerging Market (EM) equity is receiving a lot of attention as of late – and rightfully so. The MSCI EM Index (USD) is outperforming the S&P 500 by over 3.5% year-to-date. Participation is not just limited to China – markets such as South Korea, Brazil, Mexico, and South Africa are joining the party. This is all despite a struggling and beaten down India equity market. India stocks represent ~20% of the EM Index. The MSCI India Index (USD) is -4.9% year-to-date and -10.7% over the trailing 6-months. Despite this, EM Equity is outperforming nearly every other asset class year-to-date.
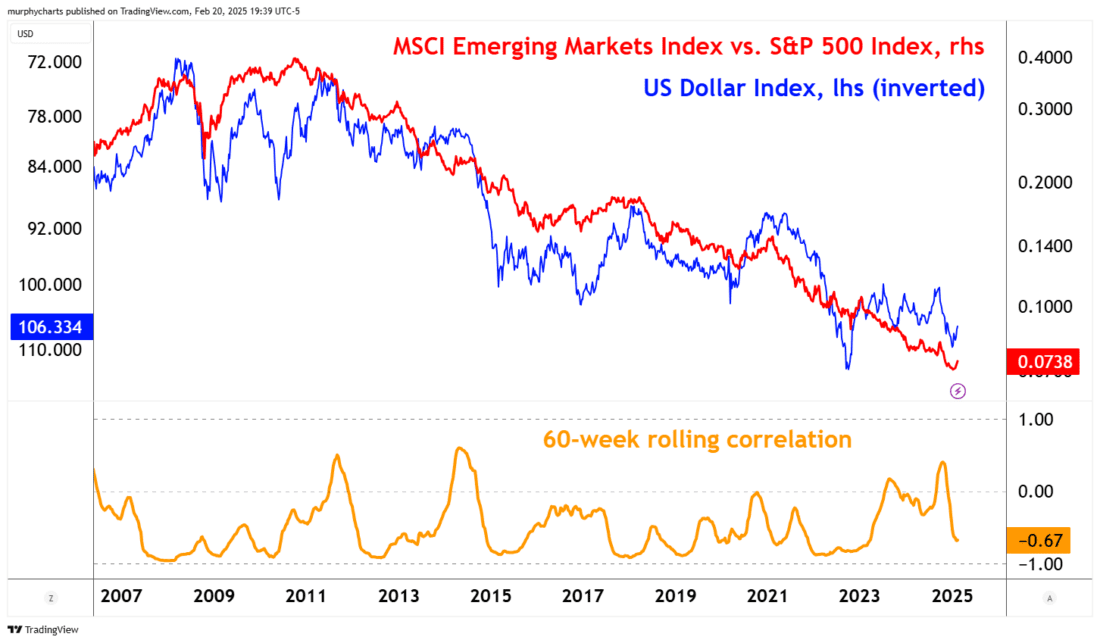
The above chart displays the ratio of EM Equity to S&P 500 Index – the ratio is overlayed with the US Dollar Index, set on an inverted scale. The chart highlights how a weak or declining dollar can provide a tailwind to EM stocks. The dollar is expected to remain strong under the current Trump Administration, but so far in 2025 the greenback continues to move counter-trend and is now testing a well-defined support level ~106. EM stocks can certainly advance alongside a strong dollar, but EM bulls are hoping for a helpful boost from King Dollar.
2/
Watch Out for US Home Construction
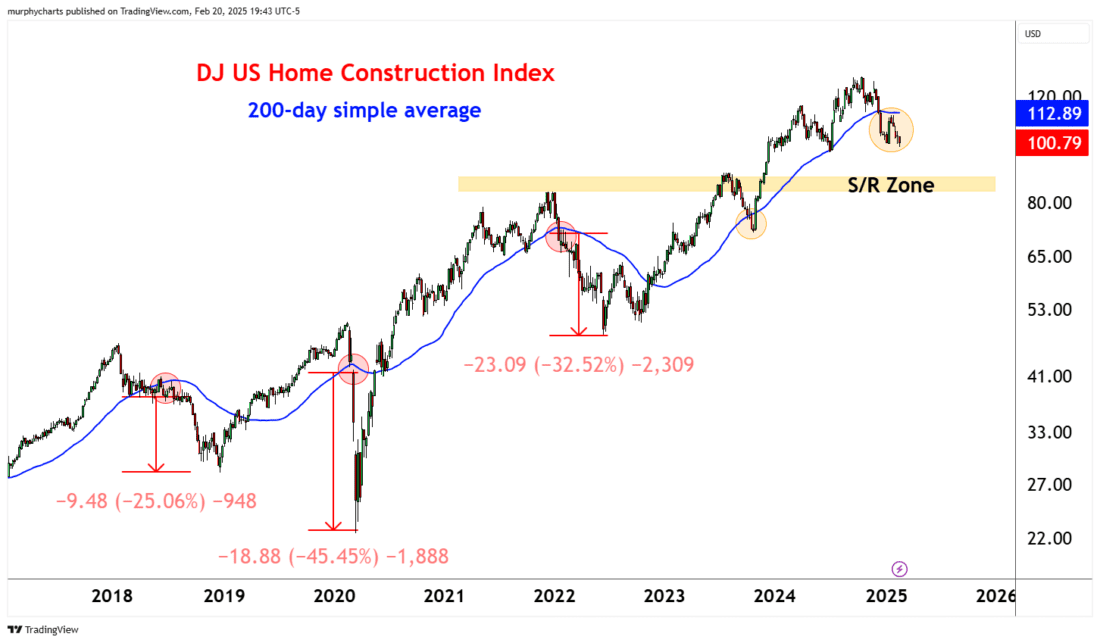
The above chart displays the Dow Jones US Home Construction Index, including the index’s 200-day simple moving average. To end 2024, the index broke below its 200-day average. In the weeks that followed, the industry group failed to recover above the 200-day and is now breaking down to new lows. The chart also highlights prior breaks below the 200-day average and the resulting drawdown. Bad things tend to happen below a declining 200-day average. From a trend-following perspective, there isn’t much to like about this industry group index.
3/
Quantum Computing + Momentum
Quantum computing stocks are receiving a ton of attention given the global boom in artificial intelligence and machine learning technologies. The below chart highlights an index of quantum computing / semiconductor stocks. The lower pane represents the 200-day Disparity Index. The Disparity index measures how far away an asset’s price is from a set moving average.
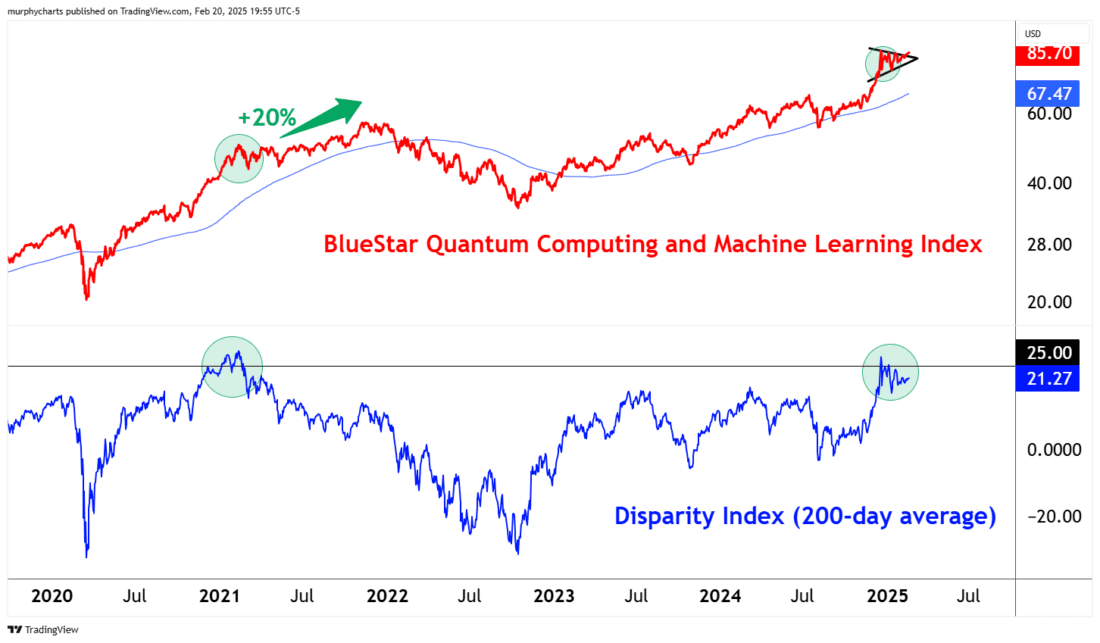
Some investors view a high reading as indication of the stock being over-extended, or ripe for a pullback. But for those who understand momentum, a high reading would indicate strong positive price momentum and therefore be assumed to continue. The prior cycle was a great example of just that. In early 2021, the 200-day Disparity index reached an historically elevated level, in the 12-months that followed, the index continued its trek gaining ~20%. Now, that isn’t to say we’ll see the same sequence play out – highly doubtful – but in my experience, trends can continue on for a lot longer than majority of investors assume they will. Just because an indicator is flashing “overbought” doesn’t mean the trend isn’t valid or the asset must correct in price. Quite the contrary.
—
Originally posted 21st February 2025
Disclosure: Investopedia
Investopedia.com: The comments, opinions and analyses expressed herein are for informational purposes only and should not be considered individual investment advice or recommendations to invest in any security or to adopt any investment strategy. While we believe the information provided herein is reliable, we do not warrant its accuracy or completeness. The views and strategies described on our content may not be suitable for all investors. Because market and economic conditions are subject to rapid change, all comments, opinions and analyses contained within our content are rendered as of the date of the posting and may change without notice. The material is not intended as a complete analysis of every material fact regarding any country, region, market, industry, investment or strategy. This information is intended for US residents only.
Disclosure: Interactive Brokers Third Party
Information posted on IBKR Campus that is provided by third-parties does NOT constitute a recommendation that you should contract for the services of that third party. Third-party participants who contribute to IBKR Campus are independent of Interactive Brokers and Interactive Brokers does not make any representations or warranties concerning the services offered, their past or future performance, or the accuracy of the information provided by the third party. Past performance is no guarantee of future results.
This material is from Investopedia and is being posted with its permission. The views expressed in this material are solely those of the author and/or Investopedia and Interactive Brokers is not endorsing or recommending any investment or trading discussed in the material. This material is not and should not be construed as an offer to buy or sell any security. It should not be construed as research or investment advice or a recommendation to buy, sell or hold any security or commodity. This material does not and is not intended to take into account the particular financial conditions, investment objectives or requirements of individual customers. Before acting on this material, you should consider whether it is suitable for your particular circumstances and, as necessary, seek professional advice.
Disclosure: Forex
There is a substantial risk of loss in foreign exchange trading. The settlement date of foreign exchange trades can vary due to time zone differences and bank holidays. When trading across foreign exchange markets, this may necessitate borrowing funds to settle foreign exchange trades. The interest rate on borrowed funds must be considered when computing the cost of trades across multiple markets.
